04Nov

Mastercard Inc. (MA) Elliott Wave Technical Analysis: Technical Insights, Stock Forecast, and Trading Strategy

Mastercard Inc. (MA) Elliott Wave Analysis

This detailed analysis of Mastercard Inc.'s Elliott Wave positioning offers insights into possible upcoming trends based on the current wave structure and technical support levels.

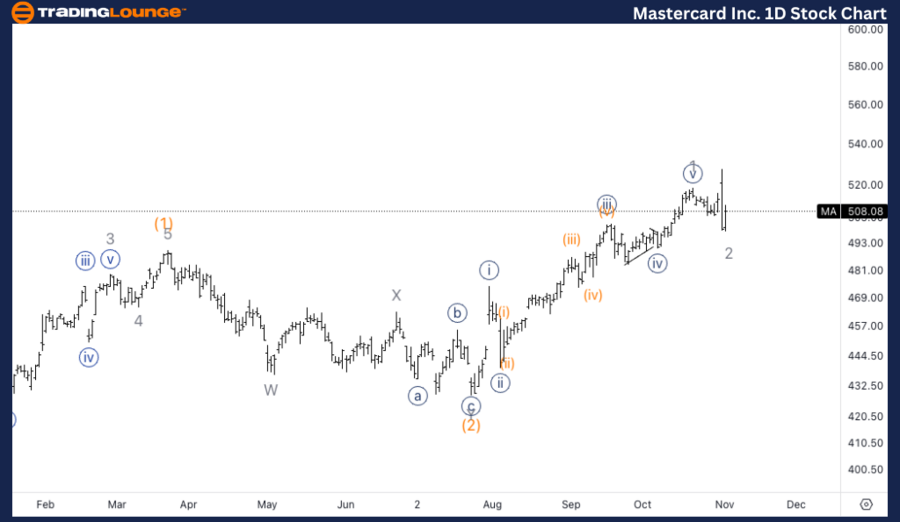
Mastercard Inc. (MA) Elliott Wave Analysis | Trading Lounge Daily Chart

MA Elliott Wave Technical Analysis

Function: Trend

Mode: Impulsive

Structure: Motive

Position: Minor wave 2

Direction: Upside in 3 of (3)

Analysis:

If this Elliott Wave count is accurate, we can expect Minor wave 2 to be a shallow retracement, as it appears to be currently. A continuation to the upside is anticipated, leading into a third of a third wave, which often exhibits strong impulsive momentum, suggesting substantial bullish action.

MA Elliott Wave Technical Analysis – Daily Chart

On the daily chart, Mastercard is likely positioned in Minor wave 2 of a broader impulsive wave structure. Assuming this wave count holds, we should see a shallow correction phase, allowing for an upward move in wave 3 of (3). The third wave in such an impulsive structure often demonstrates significant momentum, so additional upward movement is expected.

Mastercard-Inc-1d-st...


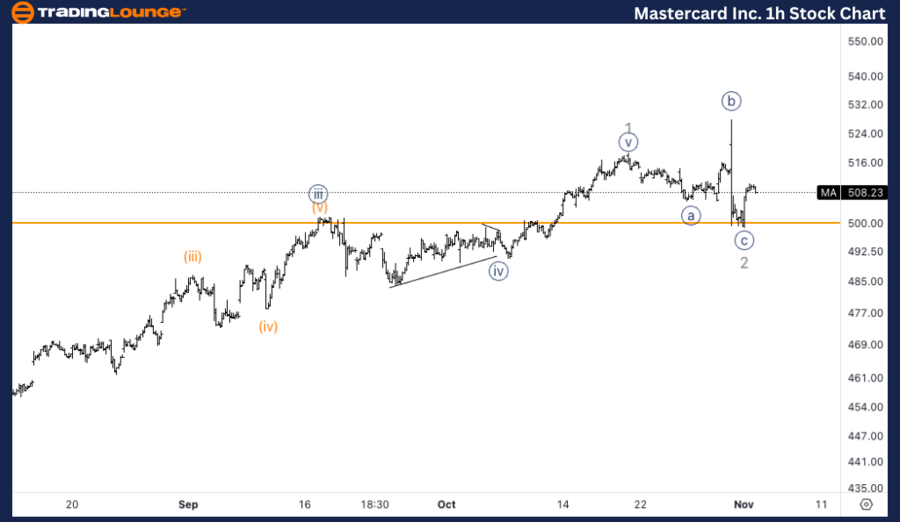
Mastercard Inc. (MA) Elliott Wave Analysis | Trading Lounge 1H Chart

MA Elliott Wave Technical Analysis

Function: Trend

Mode: Impulsive

Structure: Motive

Position: Wave {i} of 3

Direction: Upside in {i}

Analysis:

In the 1-hour chart, Mastercard seems to have completed a flat correction in wave 2, with support found near the $500 level, corresponding to TradingLevel 5. As long as this support level remains intact, we can expect the trend to continue moving upward, initiating wave {iii} to the upside.

Summary of MA Elliott Wave Analysis

This Elliott Wave analysis for Mastercard Inc. (MA) evaluates both the daily and 1-hour timeframes, using Elliott Wave Theory to forecast potential future price movement.

MA Elliott Wave Technical Analysis – 1H Chart

The 1-hour chart analysis suggests that MA may have completed a flat correction in wave 2, with wave {i} now trending upwards. Support has been established at the $500 level, which corresponds to TradingLevel 5. Provided this support holds, further upward action in wave {iii} is likely to follow.

Technical Analyst: Alessio Barretta

Source: visit Tradinglounge.com and learn From the Experts Join TradingLounge Here 

See Previous: MELI Elliott Wave Technical Analysis 

VALUE Offer - Buy 1 Month & Get 3 Months!Click here

Access 7 Analysts Over 200 Markets Covered. Chat Room With Support

Mastercard-Inc-1h-st...

Related

South32 Limited Stock Analysis & Elliott Wave Technical Forecast: Critical Validation Points and Includes a Short-Term Forecast

South32 Limited Stock Analysis & Elliott Wave Technical Forecast: Critical Validation Points and Includes a Short-Term Forecast

This analysis provides an in-depth look at ASX: South32 Limited (S32) using Elliott Wave theory. It ...

Read More >
WTI Crudeoil Commodity Elliott Wave Technical Analysis: Price Prediction and Market Trends Shaping Crude Oil Trading

WTI Crudeoil Commodity Elliott Wave Technical Analysis: Price Prediction and Market Trends Shaping Crude Oil Trading

Stay informed with our WTI crude oil Elliott Wave analysis and technical price forecast. Understand ...

Read More >
Natural Gas Commodity Elliottwave Technical Analysis: Potential Implications for Future Price Movements

Natural Gas Commodity Elliottwave Technical Analysis: Potential Implications for Future Price Movements

This article provides a comprehensive Elliott Wave analysis of the natural gas market. It discusses ...

Read More >
Potential Future of WTI and Oil Price Trends Based on Elliott Wave Analysis: Crude Oil Commodity Market Outlook

Potential Future of WTI and Oil Price Trends Based on Elliott Wave Analysis: Crude Oil Commodity Market Outlook

This article provides an in-depth Elliott wave analysis of WTI crude oil, highlighting key price mov...

Read More >
CAC 40 Elliott Wave Technical Analysis: Discover the Best Strategies for Trading the France Index, Get Forecasts, and Stay Updated

CAC 40 Elliott Wave Technical Analysis: Discover the Best Strategies for Trading the France Index, Get Forecasts, and Stay Updated

This detailed CAC 40 analysis uses Elliott Wave analysis to provide insights into current market tre...

Read More >
Learn how to apply Elliott Wave theory to forecast NEO price and optimize your crypto trading strategy with NEOUSD Technical Analysis

Learn how to apply Elliott Wave theory to forecast NEO price and optimize your crypto trading strategy with NEOUSD Technical Analysis

This article offers a comprehensive Elliott Wave analysis of NEOUSD, providing insights into NEO pri...

Read More >

$1 for 2 Weeks

then $29 a month!

What a Special Offer!

Trade Recommendations

Unleash the power of deversified trading with our comprehensive portfolio, covering 250+ markets:

  • Stock Trades
  • Crypto Trades
  • Forex Trades
  • Commodity Trades
Elliott Wave Analysis

Gain a competitive edge with expert insights and AI-powered Elliott Wave charting into:

  • Global Indices
  • US Stocks & ASX Stocks
  • Forex & Crypto
  • Commodities
Top-Notch Trading Tools

Equip yourself with the tools of success:

  • Real-time Chat rooms
  • Elliott Wave Algorithm
  • Portfolio tools
  • TradingLevels
  • Screener
  • Trading Game
7 Elliott Wave Analysts

Stay ahead of the market with daily charts and insightful videos
Your secret to strategic trading!

JOIN HERE


Welcome to TradingLounge (ASIC A.R.No. 321187), specialists in trades, trading education and technical analysis, covering stocks, indices, commodities, forex and cryptocurrencies.

When you join TradingLounge you have access to everything we offer, including trade tools, educational content and a social platform to chat with like-minded investors.

Read more

@Copyright 2024 by tradinglounge.com

Contact Us

Australian no: 02 4787 6020

International no: +61 (2) 47876020

Pay with:

Find us on