Natural Gas Wave Patterns: A Comprehensive Elliott Wave Analysis

Corrective Phase in Natural Gas Markets: Insights into Wave 4

Natural Gas Technical Analysis

Mode: Corrective for Wave 4

Structure: Double Zigzag

Position: Wave (2)

Direction: Wave (3)

In-Depth Overview: The Natural Gas market is nearing the completion of Wave (2) in a key reversal zone, setting the stage for the onset of Wave (3) should prices exit this zone.

Since April 25, 2024, Natural Gas has demonstrated a significant rally, boasting a near 45% increase. This rally is part of a broader bullish correction that began in January 2024. Despite these gains, the long-term trend still leans bearish, with expectations leaning towards a return to this trend after the current bullish retracement completes.

From Peaks to Troughs: The Journey of Natural Gas Prices The bearish impulse that began in August 2022 saw prices starting around $10. This cycle led to a drastic 85% drop in value by February 2024, with prices plummeting to as low as $1.52. The recovery phase post-February suggests a corrective pattern, possibly a zigzag or double zigzag, pending a stronger impulse to confirm a shift towards a recovery phase.

Wave 4 Dynamics and the Prospect of Wave 5 In October 2023, analysts noted the end of the 4th wave at a price point of $3.66, which preceded the 5th wave’s descent. The decline culminated in a three-swing movement by February 2024, hinting at an ending diagonal due to its three-swing initiation of the 5th wave.

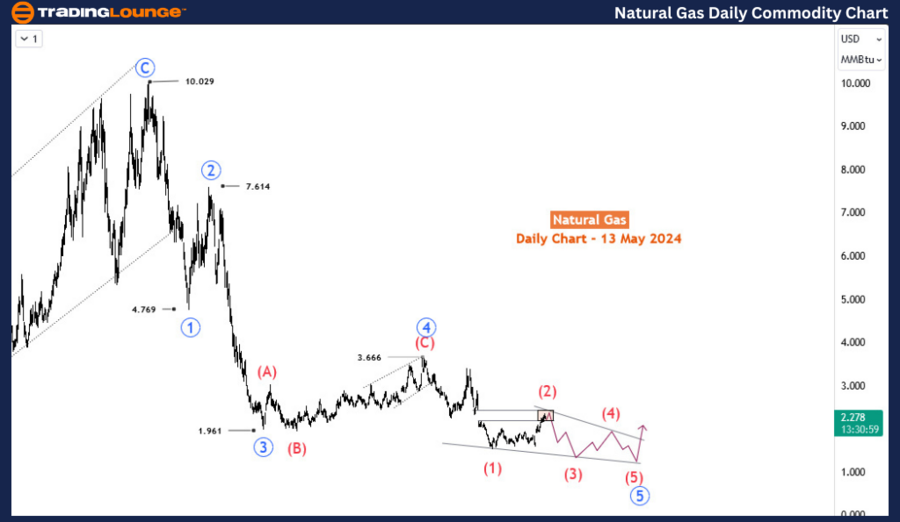
Daily Chart Analysis: Identifying Waves within Natural Gas Trends

The descent to the February low is identified as wave (1) of the 5th wave, and the current upsurge as wave (2). Wave (2) is currently in a reversal zone, suggesting the potential start of wave (3). However, should wave (2) extend further, it will likely adopt an additional three-swing structure, if the descent from the zone proves to be corrective. It is crucial for the price to stay below 3.39 to confirm the completion of wave (2).

Natural-Gas-1d-commo...


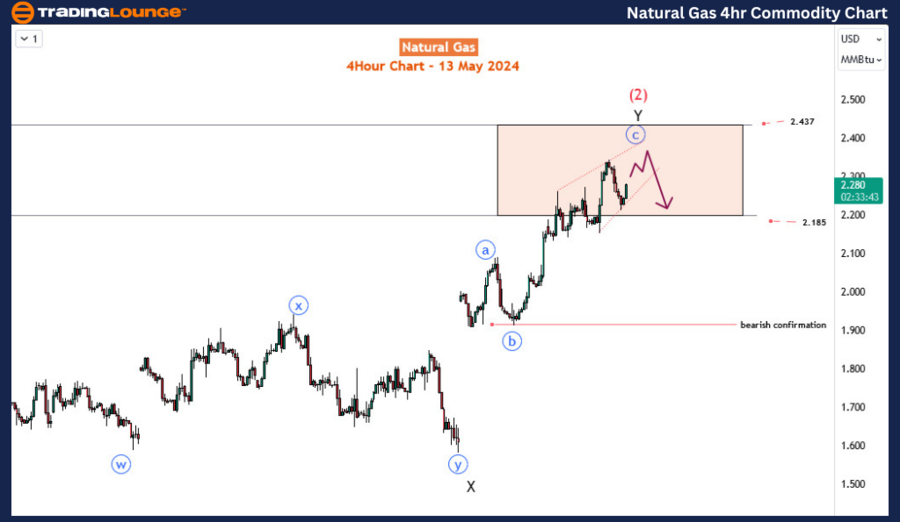
H4 Chart Examination: Double Zigzag Formation

On the H4 chart, wave (2) is evolving into a double zigzag pattern. The initiation of wave (3) would be confirmed by a bearish impulse departing from below 2.185, followed by breaking past the critical level of 2.00. This point could trigger increased selling activity, potentially driving prices to new lows not seen in over four years.

Conclusion: Natural Gas trading currently operates within a complex Elliott Wave structure, characterized by the interplay of bullish corrections and bearish impulses. Traders and analysts closely monitor these patterns to predict future movements effectively. Understanding these wave patterns is crucial for those engaged in trading, as it provides insights into potential price directions based on historical and current technical behaviors.

Technical Analyst: Sanmi Adeagbo

Source: visit Tradinglounge.com and learn From the Experts Join TradingLounge Here 

See Previous: Silver XAGUSD Commodity Elliott Wave

Special Trial Offer - 0.76 Cents a Day for 3 Months! Click here

Access 7 Analysts Over 170 Markets Covered. Chat Room With Support

Natural-Gas-4Hr-comm...

Related

GBPAUD Currency Trading: British Pound/ Australian Dollar Forex Pair (GBPAUD) Elliott Wave Technical Analysis

GBPAUD Currency Trading: British Pound/ Australian Dollar Forex Pair (GBPAUD) Elliott Wave Technical Analysis

This article provides a comprehensive analysis of GBPAUD using Elliott Wave Theory. It covers key as...

Read More >
Amazon Inc.(AMZN:NASDAQ) Elliott Wave Technical Analysis 25 October 23

Amazon Inc.(AMZN:NASDAQ) Elliott Wave Technical Analysis 25 October 23

Amazon Inc.(AMZN:NASDAQ) Elliott Wave Technical Analysis For 25 October 23 with 1-Hour and 4-Hour St...

Read More >
Stay informed and make educated decisions in the Silver XAGUSD Commodity Elliott Wave Technical Analysis

Stay informed and make educated decisions in the Silver XAGUSD Commodity Elliott Wave Technical Analysis

Discover the latest insights in our comprehensive Silver Elliott Wave Analysis. Learn about the curr...

Read More >
EURUSD Daily and 4-hour Charts: Euro/U.S.Dollar (EURUSD) Forex Elliott Wave Technical Analysis

EURUSD Daily and 4-hour Charts: Euro/U.S.Dollar (EURUSD) Forex Elliott Wave Technical Analysis

This article provides an in-depth EURUSD Elliott Wave analysis, focusing on current trends, forecast...

Read More >
ASX FORTESCUE LTD Elliott Wave Analysis: FMG Fortescue Metals Stock Forecast, Key Trading Strategies, Wave Count Insights

ASX FORTESCUE LTD Elliott Wave Analysis: FMG Fortescue Metals Stock Forecast, Key Trading Strategies, Wave Count Insights

Elliott Wave analysis explores the current wave structure of ASX: FMG (Fortescue Metals Group), high...

Read More >
Euro/British Pound(EURGBP) Elliott Wave Technical Analysis 30 November 23

Euro/British Pound(EURGBP) Elliott Wave Technical Analysis 30 November 23

EURGBP Elliott Wave Analysis Trading Lounge Day Chart dated 30 November 23, provides an insightful e...

Read More >

$1 for 2 Weeks

then $29 a month!

What a Special Offer!

Trade Recommendations

Unleash the power of deversified trading with our comprehensive portfolio, covering 250+ markets:

  • Stock Trades
  • Crypto Trades
  • Forex Trades
  • Commodity Trades
Elliott Wave Analysis

Gain a competitive edge with expert insights and AI-powered Elliott Wave charting into:

  • Global Indices
  • US Stocks & ASX Stocks
  • Forex & Crypto
  • Commodities
Top-Notch Trading Tools

Equip yourself with the tools of success:

  • Real-time Chat rooms
  • Elliott Wave Algorithm
  • Portfolio tools
  • TradingLevels
  • Screener
  • Trading Game
7 Elliott Wave Analysts

Stay ahead of the market with daily charts and insightful videos
Your secret to strategic trading!

JOIN HERE


Welcome to TradingLounge (ASIC A.R.No. 321187), specialists in trades, trading education and technical analysis, covering stocks, indices, commodities, forex and cryptocurrencies.

When you join TradingLounge you have access to everything we offer, including trade tools, educational content and a social platform to chat with like-minded investors.

Read more

@Copyright 2024 by tradinglounge.com

Contact Us

Australian no: 02 4787 6020

International no: +61 (2) 47876020

Pay with:

Find us on