ASX: FORTESCUE LTD – FMG Elliott Wave Technical Analysis TradingLounge
Greetings,
Today’s Elliott Wave analysis focuses on the Australian Stock Exchange (ASX) with FORTESCUE LTD – FMG. Our evaluation shows that ASX:FMG is nearing the end of a 2-grey corrective wave, paving the way for a potential 3-grey wave rally. This analysis highlights critical points to recognize the return of a bullish trend and where this outlook could be invalidated.
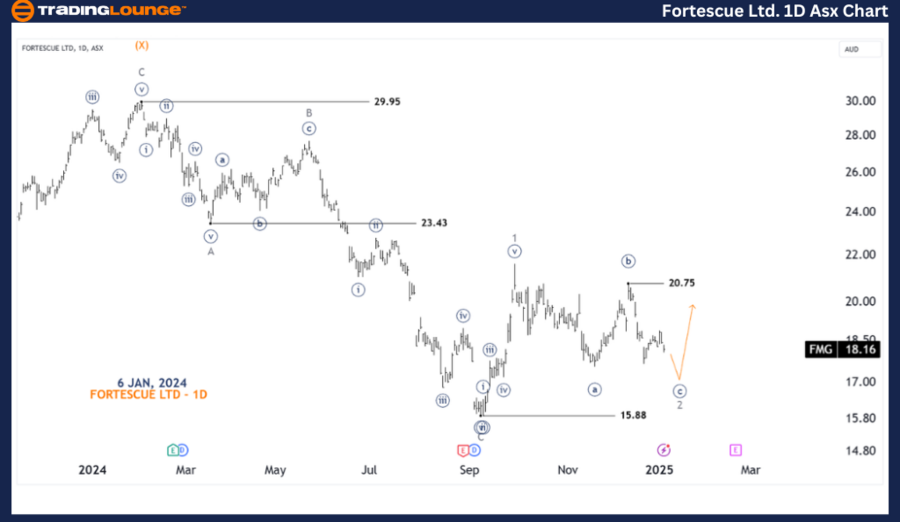
ASX: FORTESCUE LTD – FMG 1D Chart (Semilog Scale) Analysis
Function: Major trend (Minor degree, grey)
Mode: Motive
Structure: Impulse
Position: Wave ((c))-navy of Wave 2-grey
Details:
- Wave 2-grey remains incomplete and is forming a Zigzag pattern, with a probable conclusion soon.
- Extensions suggest it may push slightly lower before reversing.
- A price break above 20.75 signals readiness for Wave 3-grey to unfold.
Key Levels:
- Invalidation Point: 15.88
- Confirmation Point: 20.75

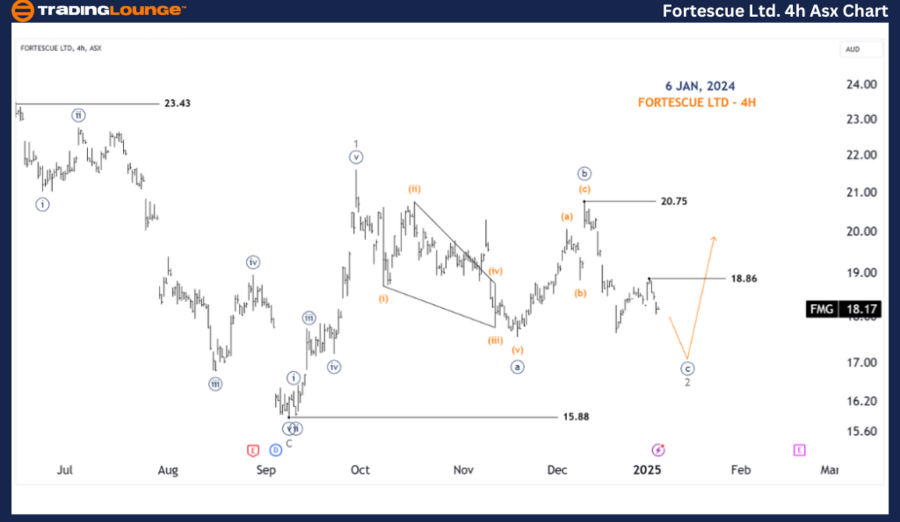
ASX: FORTESCUE LTD – FMG 4-Hour Chart Analysis
Function: Major trend (Minor degree, grey)
Mode: Motive
Structure: Impulse
Position: Wave ((c))-navy of Wave 2-grey
Details:
- The ((a))-navy wave appears as a Diagonal, albeit imperfect, serving as the best-fit wave count.
- The subsequent ((b))-navy wave is a Zigzag, followed by the nearing completion of the ((c))-navy wave.
- On the 4-hour chart, a break above 18.86 could confirm the onset of the 3-grey wave.
Key Levels:
- Invalidation Point: 15.88
- Short-Term Confirmation Point: 18.86
Technical Analyst: Hua (Shane) Cuong, CEWA-M (Master’s Designation).
Source: visit Tradinglounge.com and learn From the Experts Join TradingLounge Here
See Previous: ASX: CAR GROUP LIMITED – CAR Elliott Wave Technical Analysis
VALUE Offer - Buy 1 Month & Get 3 Months!Click here
Access 7 Analysts Over 200 Markets Covered. Chat Room With Support

Conclusion
Our Elliott Wave analysis delivers a clear outlook on ASX: FORTESCUE LTD – FMG, equipping you with actionable insights to navigate current market conditions effectively. By offering specific validation and invalidation price levels, this analysis strengthens the reliability of our wave count forecasts. Leveraging these indicators helps investors capitalize on potential bullish trends and enhances their decision-making confidence.