19Dec

ASX CAR Group Limited Elliott Wave Analysis: Stock Forecast, Price Targets, Trading Strategies, and Key Market Insights for Success

ASX: CAR GROUP LIMITED – CAR Elliott Wave Technical Analysis | TradingLounge

Elliott Wave Analysis: ASX: CAR GROUP LIMITED – CAR

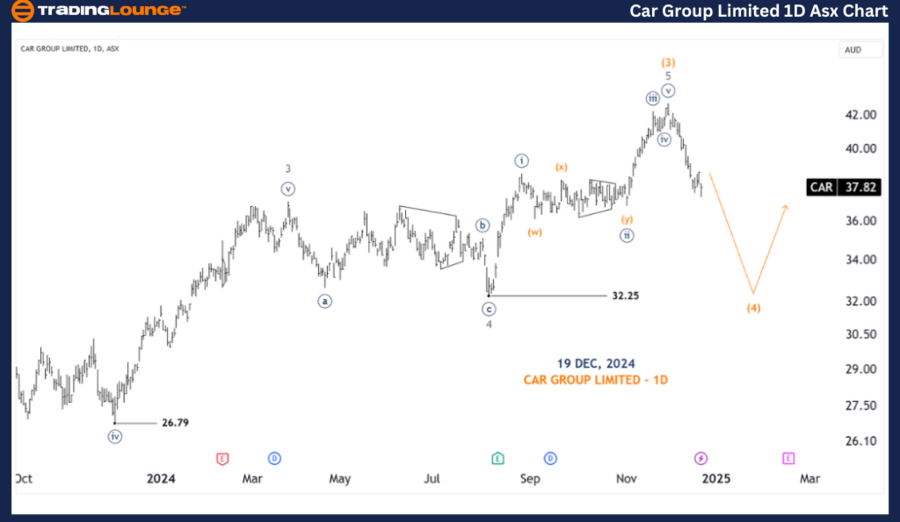
In this updated Elliott Wave analysis, we focus on the Australian Stock Exchange (ASX) CAR GROUP LIMITED – CAR. The projection suggests a continuation of a downward move with wave (4)-orange, followed by an upward movement with wave (5)-orange.

ASX: CAR GROUP LIMITED – CAR 1D Chart Analysis (Semilog Scale)

Function: Major Trend (Intermediate Degree, Grey)

Mode: Motive

Structure: Impulse

Position: Wave (4)-Orange

Details:

  • Wave (3)-orange has likely concluded, completing the sequence from wave 1-grey through wave 5-grey. This signals the onset of wave (4)-orange, which is expected to push lower, targeting the 32.25 price level.
  • After this corrective phase, wave (5)-orange is projected to resume its upward trajectory.

Invalidation Point: The termination of Wave (3)-orange serves as the invalidation benchmark.

CAR-GROUP-LIMITED-1D...


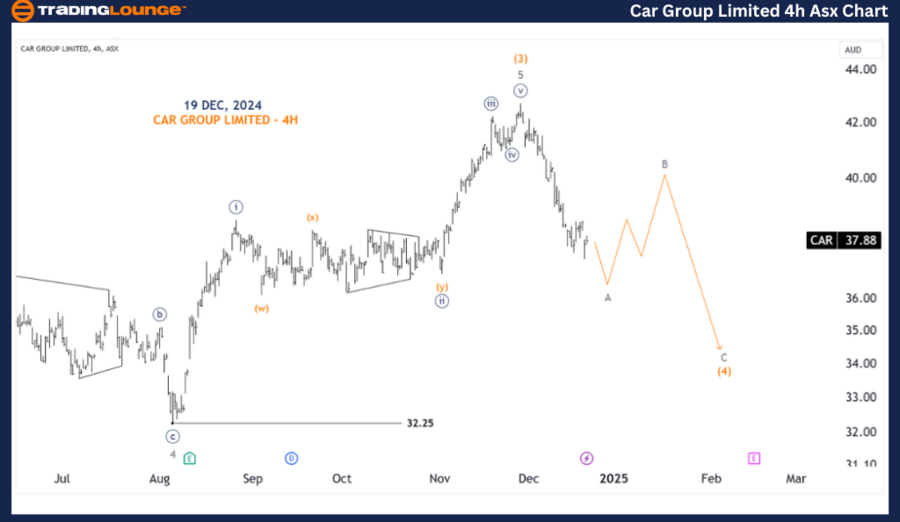
ASX: CAR GROUP LIMITED – CAR 4-Hour Chart Analysis

Function: Major Trend (Minor Degree, Grey)

Mode: Motive

Structure: Impulse

Position: Wave A-Grey of Wave (4)-Orange

Details:

  • Analyzing wave (4)-orange reveals a sharp and rapid decline, indicative of wave A in a Zigzag formation.
  • The corrective wave pattern is expected to develop as a 5-3-5 structure.
  • Wave B-grey will likely lead to a minor rebound, followed by wave C-grey continuing the downward trend.

Invalidation Point: The conclusion of Wave (3)-orange remains the critical invalidation level.

Technical Analyst: Hua (Shane) Cuong, CEWA-M (Master’s Designation).

Source: visit Tradinglounge.com and learn From the Experts Join TradingLounge Here 

See Previous: INSURANCE AUSTRALIA GROUP LIMITED Elliott Wave Technical Analysis 

VALUE Offer - Buy 1 Month & Get 3 Months!Click here

Access 7 Analysts Over 200 Markets Covered. Chat Room With Support

CAR-GROUP-LIMITED-4h...


Conclusion

Our Elliott Wave analysis provides actionable insights into ASX: CAR GROUP LIMITED – CAR. The projected corrective and impulsive movements aim to guide traders toward effective decision-making by highlighting key price levels for validation or invalidation. By combining technical patterns and price targets, this analysis delivers an objective perspective on the current market dynamics.

Related

NEOUSD Elliott Wave Analysis: Bullish Setup for Wave (3) | NEO Price Prediction and Swing Trade Strategies for Crypto Traders

NEOUSD Elliott Wave Analysis: Bullish Setup for Wave (3) | NEO Price Prediction and Swing Trade Strategies for Crypto Traders

NEOUSD is stabilising after a major decline, setting up a bullish Elliott Wave (3) rally. Learn key ...

Read More >
Cocoa Commodity Analysis & Elliott Wave Technical Forecast: Navigating the Bullish Waves

Cocoa Commodity Analysis & Elliott Wave Technical Forecast: Navigating the Bullish Waves

This comprehensive analysis provides a deep dive into the cocoa market's bullish trend, leveragi...

Read More >
Understanding MSTR US Stock Market Trajectory and Support Levels: MicroStrategy Inc. (MSTR) Elliott Wave Technical Analysis

Understanding MSTR US Stock Market Trajectory and Support Levels: MicroStrategy Inc. (MSTR) Elliott Wave Technical Analysis

Explore the Elliott Wave Theory as applied to MicroStrategy Inc. (MSTR), providing a comprehensive a...

Read More >
Unlocking Opportunities: Uniswap/U.S. dollar (UNIUSD) Elliott Wave Technical Analysis and Trading Strategy

Unlocking Opportunities: Uniswap/U.S. dollar (UNIUSD) Elliott Wave Technical Analysis and Trading Strategy

The text provides Elliott Wave Technical Analysis for Uniswap/ U.S. dollar (UNIUSD) as of February 2...

Read More >
TASI Index Elliott Wave Analysis: Bullish Trend Forecast and Key Invalidation Level Insights

TASI Index Elliott Wave Analysis: Bullish Trend Forecast and Key Invalidation Level Insights

The TASI Index is currently in a strong bullish phase, as identified by Elliott Wave analysis. With ...

Read More >
S&P 500 Elliott Wave Analysis with Daily and Weekly Charts Highlighting Impulsive Trends, Wave Counts, and Market Forecasts

S&P 500 Elliott Wave Analysis with Daily and Weekly Charts Highlighting Impulsive Trends, Wave Counts, and Market Forecasts

S&P 500 Elliott Wave analysis on both daily and weekly timeframes. It outlines the current market po...

Read More >

Buy 1 Month

Get 3 Months!

Special Offer:

Trade Recommendations

Unleash the power of deversified trading with our comprehensive portfolio, covering:

  • Stock Trades
  • Crypto Trades
  • Forex Trades
  • Commodity Trades
Elliott Wave Analysis

Gain a competive edge with expert insights in to:

  • Global Indices
  • US Stocks & ASX Stocks
  • Forex & Crypto
  • Commodities
Top-Notch Trading Tools

Equip yourself with the tools of success:

  • Social Chat
  • Elliott Wave Algorithm
  • Screener
  • TradingLevels
  • Trading Game
7 Elliott Wave Analysts

Stay ahead of the market with daily charts and insightful videos
-Your secret to strategic trading!

JOIN HERE


Welcome to TradingLounge (ASIC A.R.No. 321187), specialists in trades, trading education and technical analysis, covering stocks, indices, commodities, forex and cryptocurrencies.

When you join TradingLounge you have access to everything we offer, including trade tools, educational content and a social platform to chat with like-minded investors.

Read more

@Copyright 2024 by tradinglounge.com

Contact Us

Australian no: 02 4787 6020

International no: +61 (2) 47876020

Pay with:

Find us on