Gold XAUUSD Elliott Wave Technical Analysis
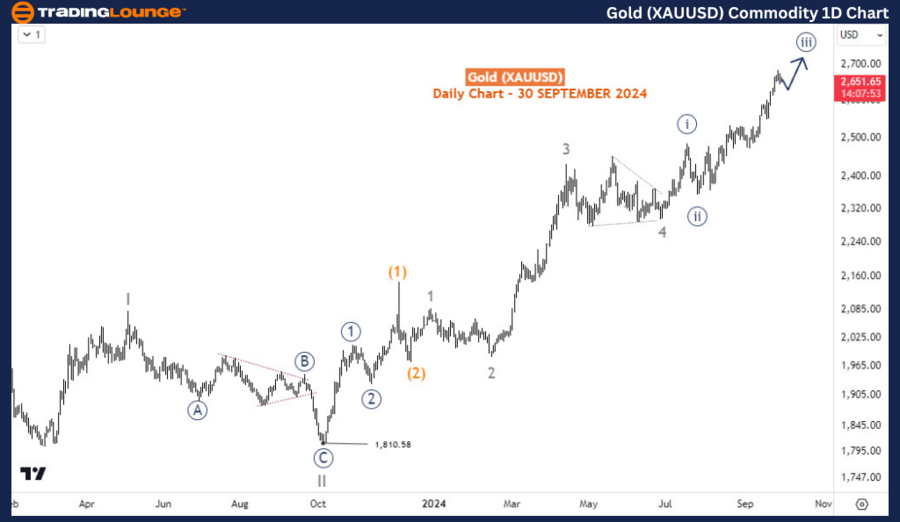
Gold has seen a pullback in the last days of September after hitting another all-time high. The ongoing impulse wave cycle, which started in October 2022, indicates that once the current correction finds support, further rallies could follow.
Gold XAUUSD Commodity Daily Chart Analysis
From an Elliott Wave standpoint, the daily chart reveals that Gold began a cycle degree impulse wave sequence in October 2022. Waves I and II of this sequence completed in May 2023 and October 2023, respectively. Gold is now in the third wave, with wave III still incomplete. Specifically, Gold is in wave 5 of (3) of 3 (circled) of III, suggesting that significant upside potential remains. This analysis points to Gold's bullish trend continuing, with potential pullbacks offering traders buying opportunities as the upward trend likely resumes.

Gold XAUUSD Commodity H4 Chart Analysis
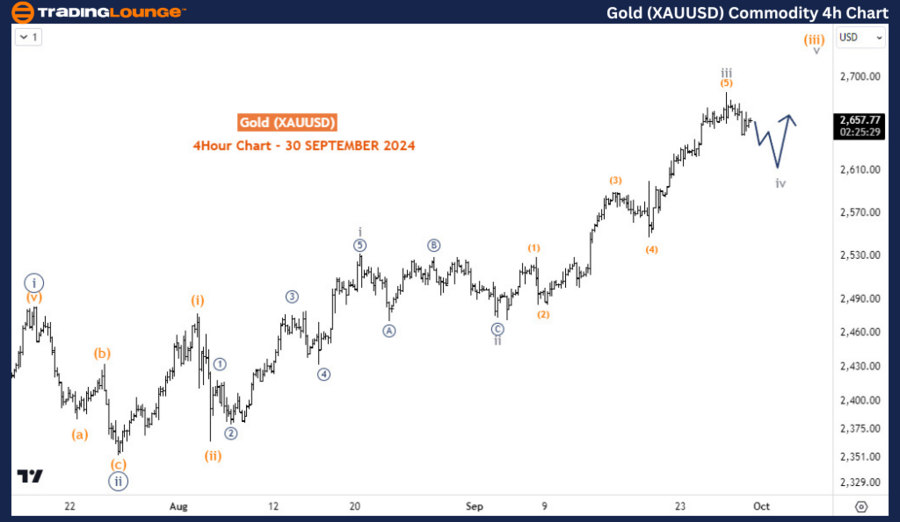
On the H4 chart, Gold is experiencing a pullback, likely forming sub-minuette degree wave iv of minuette degree wave (iii) of minute degree wave iii (circled). After wave iv finds support, bullish momentum is expected to return, continuing the rally. Buyers could look for entry points near the dip, anticipating the upward trend to resume once wave iv is completed.
Technical Analyst: Sanmi Adeagbo
Source: visit Tradinglounge.com and learn From the Experts Join TradingLounge Here
See Previous: Cocoa Elliott Wave Technical Analysis
VALUE Offer - Buy 1 Month & Get 3 Months!Click here
Access 7 Analysts Over 200 Markets Covered. Chat Room With Support

Conclusion
In summary, Gold remains in a long-term bullish trend, with more rallies expected after the current pullback ends. Elliott Wave analysis suggests that wave III is still developing, leaving room for more upside potential. Traders should monitor key support levels, as these pullbacks could offer attractive buying opportunities before Gold resumes its upward movement.