05Feb

XOM Elliott Wave Analysis: Technical Insights on Exxon Mobil Corp. - 5 February 24

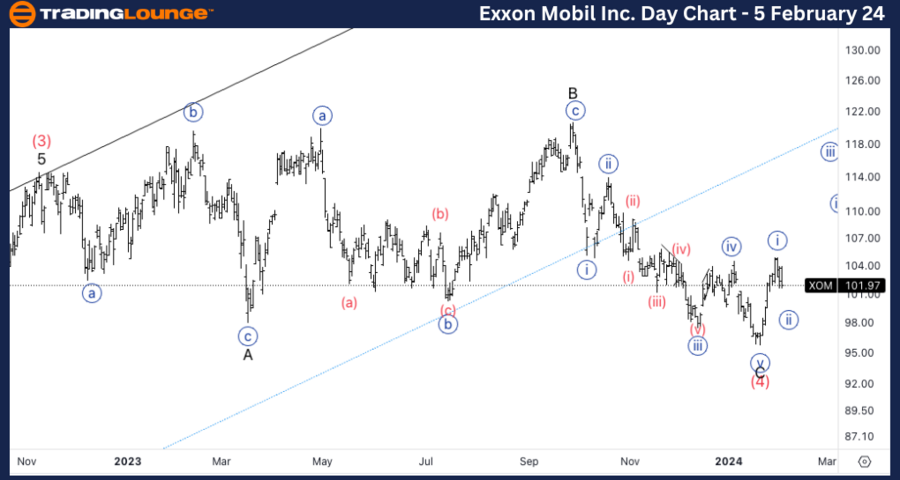
XOM Elliott Wave Analysis Trading Lounge Daily Chart, 5 February 24

Exxon Mobil Corp., (XOM) Daily Chart

XOM Elliott Wave Technical Analysis

FUNCTION: Trend

MODE: Impulse

STRUCTURE: Motive

POSITION: Minute wave {ii} of 1.  

DIRECTION: Bottom in wave {ii}.  

DETAILS: Looking for a clear five wave move into Minor wave 1. We are finding support on top of TL 100$, which gives us additional confidence to look for further upside.

Technical Analyst: Alessio Barretta

Source: visit Tradinglounge.com and learn From the Experts Join TradingLounge Here 

See Previous: Costco Wholesale Corp. (COST) 
Exxon-Mobil-day-stoc...


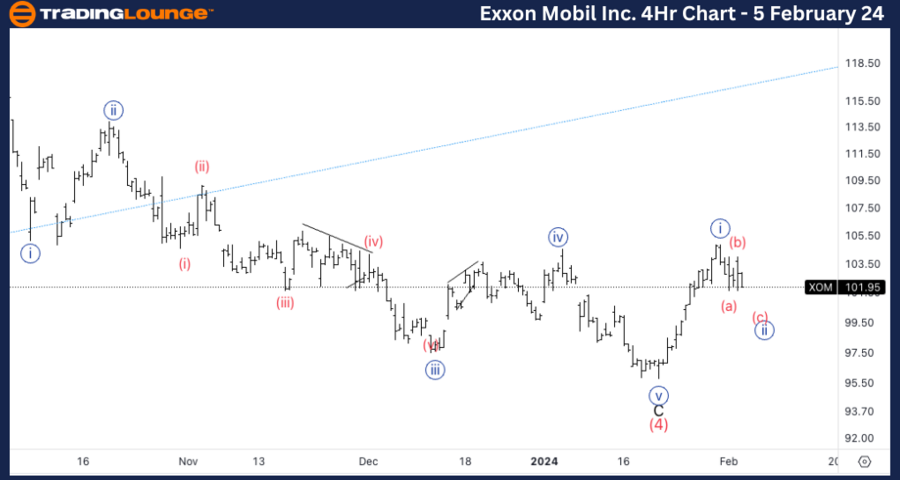
XOM Elliott Wave Analysis Trading Lounge 4Hr Chart, 5 February 24

Exxon Mobil Corp.,  (XOM) 4Hr Chart

XOM Elliott Wave Technical Analysis

FUNCTION: Counter Trend

MODE: Corrective

STRUCTURE: Zigzag  

POSITION: Wave (c) of {ii}.

DIRECTION: Bottoming in wave (c).

DETAILS: Looking for further downside into wave (c) to complete Minute wave {ii}. Looking to find support on top of 100$ as long as we have a clear three wave move in wave {ii}.

Welcome to our XOM Elliott Wave Analysis Trading Lounge, where we navigate the waves of Exxon Mobil Corp. (XOM) through insightful Elliott Wave Technical Analysis. As of the Daily Chart on 5th February 2024, we uncover significant trends in the market.

*XOM Elliott Wave Technical Analysis – Daily Chart*

In terms of wave dynamics, we identify a prevailing impulse function with a motive structure. The present position is in Minute wave {ii} of 1, signaling a bottom in wave C. Our focus is on a clear five-wave move into Minor wave 1. The reinforcement of support on top the trendline at $100 boosts our confidence in anticipating further upside movements.

*XOM Elliott Wave Technical Analysis – Daily Chart*

Here, the wave function adopts a counter trend approach with a corrective mode, manifesting a zigzag structure. The current position is in Wave (c) of {ii}, indicating a bottoming in wave (c). Our attention is on the projected downside into wave (c) to complete Minute wave {ii}. We are actively monitoring for support, particularly above $100, ensuring clarity in the three-wave move within wave {ii}.
Exxon-Mobil-4h-stock...

Related

ASX: SCG (Scentre Group) Elliott Wave Analysis and Stock Forecast Report Covers Key Price Levels and Trading Strategies

ASX: SCG (Scentre Group) Elliott Wave Analysis and Stock Forecast Report Covers Key Price Levels and Trading Strategies

Discover the latest ASX: SCG (Scentre Group) insights with our Elliott Wave technical analysis. This...

Read More >
Binance Crypto Price News Today Elliott Wave Technical Analysis: Depth Cryptocurrency Analysis and BNBUSD Price Predictions

Binance Crypto Price News Today Elliott Wave Technical Analysis: Depth Cryptocurrency Analysis and BNBUSD Price Predictions

This article dives into BNBUSD Elliott Wave analysis, providing insights into Binance Coin’s potent...

Read More >
 Iron Ore Commodity Elliott Wave Technical Analysis: Bullish Impulse Set to Resume

Iron Ore Commodity Elliott Wave Technical Analysis: Bullish Impulse Set to Resume

In the realm of iron ore trading, as of February 22, 2024, Elliott Wave analysis reveals a potential...

Read More >
Bitcoin Elliott Wave Analysis: BTC/USD Price Forecast, Support & Resistance Levels, and Key Market Trends for Traders

Bitcoin Elliott Wave Analysis: BTC/USD Price Forecast, Support & Resistance Levels, and Key Market Trends for Traders

This Elliott Wave analysis of BTC/USD provides insights into Bitcoin’s current trend, price targets...

Read More >
British Pound / Australian Dollar (GBPAUD) Elliott Wave Technical Forecast: Bullish Trend Setup, Daily and 4-Hour Chart Outlook

British Pound / Australian Dollar (GBPAUD) Elliott Wave Technical Forecast: Bullish Trend Setup, Daily and 4-Hour Chart Outlook

GBPAUD Elliott Wave analysis focusing on the ongoing wave 2 correction within a larger bullish wave ...

Read More >
USDCHF Elliott Wave Technical Analysis: Price Prediction, Trading Strategy, Bearish Trend, Wave Count & Market Outlook

USDCHF Elliott Wave Technical Analysis: Price Prediction, Trading Strategy, Bearish Trend, Wave Count & Market Outlook

This USDCHF Elliott Wave Analysis provides a detailed technical breakdown of the market, highlightin...

Read More >

$1 for 2 Weeks

then $29 a month!

What a Special Offer!

Trade Recommendations

Unleash the power of deversified trading with our comprehensive portfolio, covering 250+ markets:

  • Stock Trades
  • Crypto Trades
  • Forex Trades
  • Commodity Trades
Elliott Wave Analysis

Gain a competitive edge with expert insights and AI-powered Elliott Wave charting into:

  • Global Indices
  • US Stocks & ASX Stocks
  • Forex & Crypto
  • Commodities
Top-Notch Trading Tools

Equip yourself with the tools of success:

  • Real-time Chat rooms
  • Elliott Wave Algorithm
  • Portfolio tools
  • TradingLevels
  • Screener
  • Trading Game
7 Elliott Wave Analysts

Stay ahead of the market with daily charts and insightful videos
Your secret to strategic trading!

JOIN HERE


Welcome to TradingLounge (ASIC A.R.No. 321187), specialists in trades, trading education and technical analysis, covering stocks, indices, commodities, forex and cryptocurrencies.

When you join TradingLounge you have access to everything we offer, including trade tools, educational content and a social platform to chat with like-minded investors.

Read more

@Copyright 2024 by tradinglounge.com

Contact Us

Australian no: 02 4787 6020

International no: +61 (2) 47876020

Pay with:

Find us on