18Nov

Unlocking ASX Trading Success: TELSTRA GROUP LIMITED - TLS Stock Analysis & Elliott Wave Technical Forecast

Elliott Wave Analysis for TLS on the Australian Stock Exchange (ASX)

Our latest Elliott Wave analysis examines TELSTRA GROUP LIMITED (TLS.ASX), highlighting potential opportunities in the current market structure. We observe that wave (2)-orange may have concluded, positioning TLS.ASX for a significant long-term upward trend with wave (3)-orange now likely unfolding.

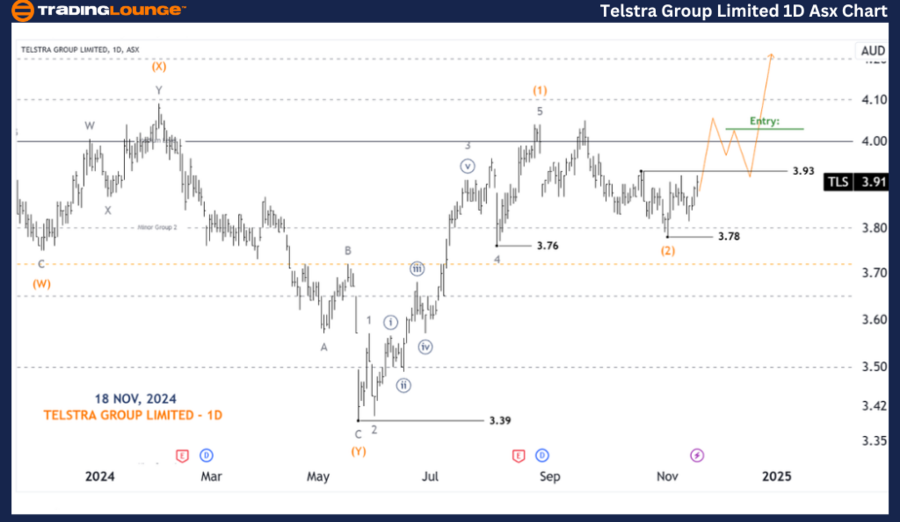
ASX: TELSTRA GROUP LIMITED (TLS) - 1D Chart (Semilog Scale) Analysis

ASX: TELSTRA GROUP LIMITED (TLS) - Elliott Wave Technical Analysis

Key Aspects:

Trend Level: Major (Intermediate degree, orange)

Wave Mode: Motive

Wave Structure: Impulse

Current Position: Wave (3)-orange of Wave ((3))-navy

Details:

Evidence suggests that wave (2)-orange may have concluded, with wave (3)-orange emerging. A strong price movement upward, followed by support at $4.00, aligns with a bullish market outlook targeting higher levels, such as $5.00.

  • Invalidation Point: $3.39

TELSTRA-GROUP-LIMITE...


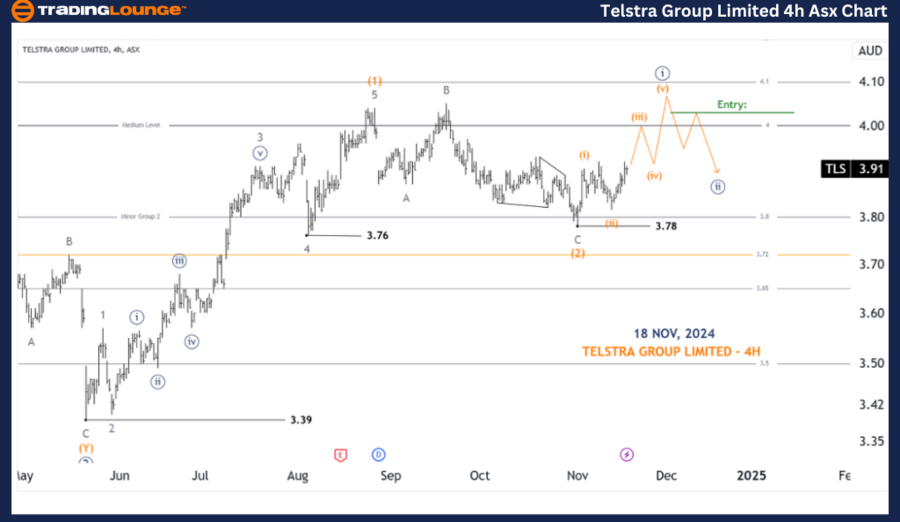
ASX: TELSTRA GROUP LIMITED (TLS) - 4-Hour Chart Analysis

Key Aspects:

Trend Level: Major (Minuette degree, navy)

Wave Mode: Motive

Wave Structure: Impulse

Current Position: Wave (iii)-orange of Wave ((i))-navy

Details:

Following the low at $3.78, wave (2)-orange appears to have concluded. Wave (3)-orange is advancing, with its wave ((i))-navy nearing completion. As wave ((i))-navy progresses from wave (i)-orange to wave (v)-orange, wave ((ii))-navy will likely initiate a corrective push lower before wave ((iii))-navy propels higher.

  • Trading Opportunity: A long trade setup will become attractive when $4.00 is confirmed as strong support.
  • Invalidation Point: $3.78

Technical Analyst: Hua (Shane) Cuong, CEWA-M (Master’s Designation).

Source: visit Tradinglounge.com and learn From the Experts Join TradingLounge Here 

See Previous: Westpac Banking Corporation (WBC) Elliott Wave Technical Analysis 

VALUE Offer - Buy 1 Month & Get 3 Months!Click here

Access 7 Analysts Over 200 Markets Covered. Chat Room With Support

TELSTRA-GROUP-LIMITE...


Conclusion: Navigating the Current Market Trends

This Elliott Wave analysis provides insights into the broader market structure and immediate opportunities for ASX: TELSTRA GROUP LIMITED (TLS). By identifying critical price points for validation and invalidation, traders can make informed decisions with increased confidence. As wave structures evolve, specific entry and exit levels will further clarify high-quality trading opportunities aligned with a bullish outlook.

Related

Detailed Insights into the Palo Alto Networks Inc.Stock Performance: PANW Stocks Elliott Wave Technical Analysis

Detailed Insights into the Palo Alto Networks Inc.Stock Performance: PANW Stocks Elliott Wave Technical Analysis

Our latest Elliott Wave analysis of Palo Alto Networks Inc. (PANW) offers detailed insights into the...

Read More >
Forex Trading Strategy and Price Predictions for the British Pound to Australian Dollar Pair Based on Technical Analysis

Forex Trading Strategy and Price Predictions for the British Pound to Australian Dollar Pair Based on Technical Analysis

Get an in-depth look at GBPAUD Elliott Wave analysis with insights into current trends, forecasts, a...

Read More >
Theta Token (THETAUSD) Crypto Elliott Wave Update: Resistance Could Trigger Bullish Reversal After Wave 5 Completion and Recovery

Theta Token (THETAUSD) Crypto Elliott Wave Update: Resistance Could Trigger Bullish Reversal After Wave 5 Completion and Recovery

THETAUSD shows potential bullish reversal after a completed 5-wave drop. Resistance at $0.75 is key,...

Read More >
Vanguard Australian Shares Index V300AEQ ETF UNITS – VAS Stock Analysis & Elliott Wave Technical Forecast

Vanguard Australian Shares Index V300AEQ ETF UNITS – VAS Stock Analysis & Elliott Wave Technical Forecast

This article provides an in-depth Elliott Wave analysis of ASX: V300AEQ ETF Units – VAS, focusing o...

Read More >
Grasim Industries Elliott Wave Forecast: Chart Analysis Shows Bullish Momentum and Strong Upside in Indian Stock Market

Grasim Industries Elliott Wave Forecast: Chart Analysis Shows Bullish Momentum and Strong Upside in Indian Stock Market

Grasim Industries shows a bullish Elliott Wave pattern on both daily and weekly charts, forecasting ...

Read More >
Costco Wholesale Corp.(COST) Stocks Elliott Wave Technical Analysis: Focusing on both daily and 4-hour charts

Costco Wholesale Corp.(COST) Stocks Elliott Wave Technical Analysis: Focusing on both daily and 4-hour charts

This article provides a detailed Elliott Wave analysis of Costco Wholesale Corp. (COST) focusing on ...

Read More >

$1 for 2 Weeks

then $29 a month!

What a Special Offer!

Trade Recommendations

Unleash the power of deversified trading with our comprehensive portfolio, covering 250+ markets:

  • Stock Trades
  • Crypto Trades
  • Forex Trades
  • Commodity Trades
Elliott Wave Analysis

Gain a competitive edge with expert insights and AI-powered Elliott Wave charting into:

  • Global Indices
  • US Stocks & ASX Stocks
  • Forex & Crypto
  • Commodities
Top-Notch Trading Tools

Equip yourself with the tools of success:

  • Real-time Chat rooms
  • Elliott Wave Algorithm
  • Portfolio tools
  • TradingLevels
  • Screener
  • Trading Game
7 Elliott Wave Analysts

Stay ahead of the market with daily charts and insightful videos
Your secret to strategic trading!

JOIN HERE


Welcome to TradingLounge (ASIC A.R.No. 321187), specialists in trades, trading education and technical analysis, covering stocks, indices, commodities, forex and cryptocurrencies.

When you join TradingLounge you have access to everything we offer, including trade tools, educational content and a social platform to chat with like-minded investors.

Read more

@Copyright 2024 by tradinglounge.com

Contact Us

Australian no: 02 4787 6020

International no: +61 (2) 47876020

Pay with:

Find us on