EURUSD Elliott Wave Analysis Trading Lounge Day Chart
Euro/U.S.Dollar(EURUSD) Day Chart Analysis
EURUSD Elliott Wave Technical Analysis
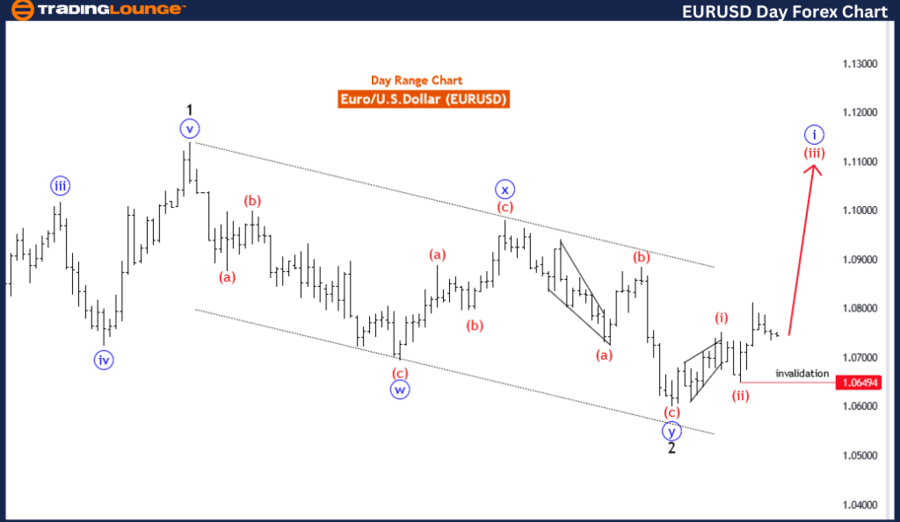
FUNCTION: Trend
MODE: impulsive
STRUCTURE: red wave 3
POSITION: Blue Wave 1
DIRECTION NEXT LOWER DEGREES: red wave 4
DETAILS: red wave 2 of blue wave 1 looking completed at 1.06494, now red wave 3 of 1 is in play.
Wave Cancel invalid level: 1.06494
The EUR/USD Elliott Wave Analysis for the Daily Chart shows that the Euro against the U.S. Dollar is currently in an impulsive wave pattern, indicating that the overall market trend is characterized by strong directional movement.
Function
The function is "Trend," suggesting that the market is moving in a clear direction, which aligns with a larger wave pattern, typically indicating significant momentum in one direction.
Mode
The mode is "impulsive," pointing to a strong, direct market movement that typically represents the larger driving force behind the trend. Impulsive waves are often characterized by rapid price changes and high volatility.
Structure
The structure is described as "red wave 3," indicating that the market is in a strong upward or downward movement, often seen as the main thrust within a broader wave structure. This wave usually sees significant price changes in a relatively short time frame.
Position
The position is "blue wave 1," indicating that the market has completed a prior wave sequence and is now in the first sub-wave of the next structure. This stage is crucial for confirming the direction of the impulsive move.
Direction for the Next Lower Degrees
The direction for the next lower degrees points towards "red wave 4," suggesting that once the current wave concludes, there could be a corrective phase before resuming the trend. This stage often sees a retracement or consolidation in the market.
Details
The details section indicates that "red wave 2 of blue wave 1" seems completed at 1.06494, suggesting that the current corrective phase has ended or is nearing completion. Now, "red wave 3 of 1" is in play, which typically implies a strong directional movement. The wave cancellation or invalidation level is set at 1.06494, marking a critical point where the current wave structure could be invalidated, leading to a reevaluation of the wave pattern.
In summary, the EUR/USD Elliott Wave Analysis for the Daily Chart highlights an impulsive structure with "red wave 3" in progress, suggesting that the market is in a strong trend. The completion of "red wave 2" and the commencement of "red wave 3 of blue wave 1" signal a significant market movement. The wave cancellation level at 1.06494 serves as a key point to watch, as it indicates where the current wave pattern could be invalidated, potentially requiring a new analysis.
Bitcoin Prediction Guess the Price? Test Your Analysis - Win 1 Million Satoshi
EURUSD Elliott Wave Analysis Trading Lounge 4-Hour Chart
Euro/U.S.Dollar(EURUSD) 4 Hour Chart Analysis
EURUSD Elliott Wave Technical Analysis
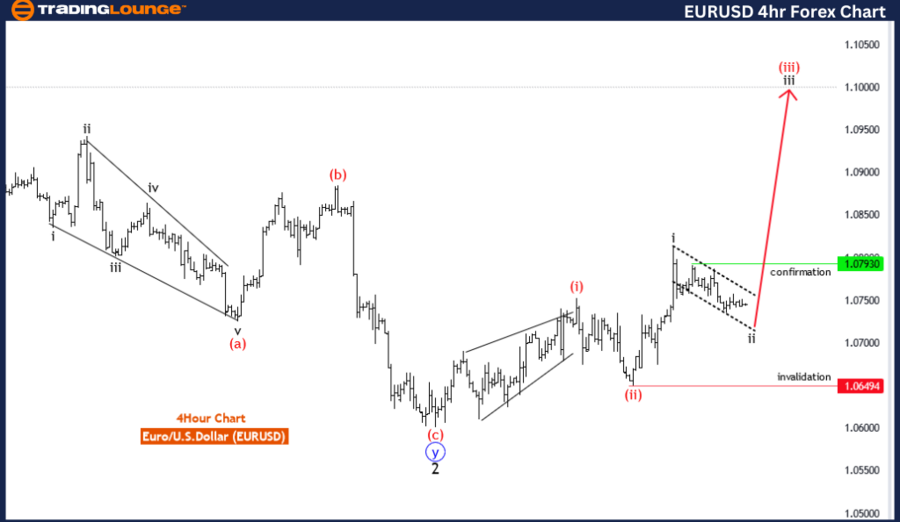
FUNCTION: Trend
MODE: corrective
STRUCTURE: black wave 2
POSITION: Red Wave 3
DIRECTION NEXT LOWER DEGREES: black wave 3
DETAILS: black wave 2 of or red wave 3 is in play and looking near to end. Wave Cancel invalid level: 1.06494
The EUR/USD Elliott Wave Analysis for the 4-Hour Chart suggests that the Euro against the U.S. Dollar is in a corrective phase, with the potential for an impending trend change or a continuation of the existing pattern.
Function
The function of the current analysis is identified as "Trend," indicating that the overall market movement is in line with a larger trend, albeit in a corrective stage.
Mode
The mode is described as "corrective," signifying that the existing market pattern may involve complex wave structures, typically seen during periods of retracement or consolidation within a broader trend.
Structure
The structure is noted as "black wave 2," suggesting that the second wave within a broader wave sequence is in progress. This is a critical phase, often representing a correction or retracement after a more significant movement in the market.
Position
The current position is "red wave 3," which indicates a potential transition within the broader wave structure. This phase is crucial as it might signal a trend reversal or continuation, depending on how the market reacts at this level.
Direction for the Next Higher Degrees
The next lower degrees point towards "black wave 3," indicating that once the current corrective phase concludes, there could be a significant movement in the market's primary direction, typically suggesting an upward shift.
Details
The details section describes that "black wave 2 of red wave 3" is either in play or nearing completion. This suggests that the corrective phase is at or approaching its end, hinting at a potential shift in market direction. The wave cancellation or invalidation level is set at 1.06494, marking a critical point where the current wave pattern could be invalidated, necessitating a reevaluation of the analysis.
In summary, the EUR/USD Elliott Wave Analysis for the 4-Hour Chart outlines a corrective structure with "black wave 2" in progress, indicating a possible end to the correction and a subsequent shift in the market. The wave cancellation level at 1.06494 is crucial, as it signifies the point at which the current pattern may require re-evaluation. As "red wave 3" reaches its conclusion, the focus shifts to "black wave 3," pointing to potential new trends or a continuation of the existing pattern.
Technical Analyst: Malik Awais
Source: visit Tradinglounge.com and learn From the Experts Join TradingLounge Here
See Previous: British Pound/Japanese Yen(GBPJPY) Elliott Wave Technical Analysis
Special Trial Offer - 0.76 Cents a Day for 3 Months! Click here
Access 6 Analysts covering over 150 Markets. Chat Room With Support