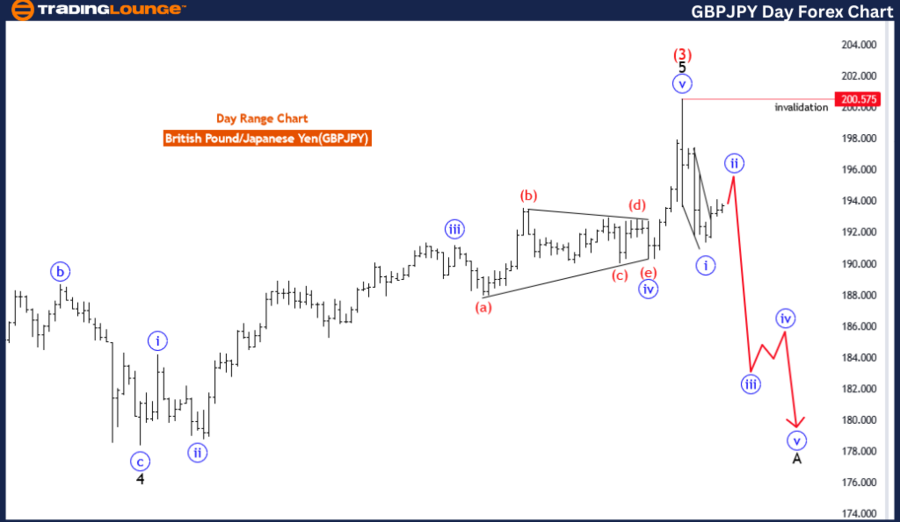
GBPJPY Elliott Wave Analysis Trading Lounge Day Chart,
British Pound/Japanese Yen(GBPJPY) Day Chart Analysis
GBPJPY Elliott Wave Technical Analysis
FUNCTION: Counter Trend
MODE: Corrective
STRUCTURE: blue wave 2
POSITION: black wave A of 4
DIRECTION NEXT LOWER DEGREES: blue wave 3
DETAILS: blue wave 1 of A looking completed at 191.361, now blue wave 2 of A is in play.
Wave Cancel invalid level: 200.575
The GBP/JPY Elliott Wave Analysis for the Day Chart outlines the current corrective wave patterns that are shaping the movement of the British Pound against the Japanese Yen, indicating the potential for future directional changes.
Function
The function of the analysis is "Counter Trend," suggesting that the market is currently in a corrective phase that runs against the primary trend.
Mode
The mode is "Corrective," indicating that the current wave structure involves complex patterns, often seen during periods of market consolidation or trend reversal.
Structure
The structure is described as "blue wave 2" within "black wave A of 4." This suggests that the market is undergoing a correction within the context of a broader wave pattern, signalling a potential turning point before the primary trend resumes.
Position
The current position is noted as "black wave A of 4," indicating that the first wave within the correction phase has been completed. This marks a transitional phase in the overall wave structure, suggesting a possible continuation of the corrective pattern before entering the next major trend.
Direction for the Next Lower Degrees
The next lower degrees indicate "blue wave 3," pointing towards the continuation of the corrective structure. This could lead to further consolidation or a new trend direction once the current phase is completed.
Details
In the details section, the analysis suggests that "blue wave 1 of A" is completed at 191.361. This indicates that the first wave within the larger corrective structure has ended. The market is now in "blue wave 2 of A," signifying a period of consolidation or correction before transitioning to the next wave, potentially "blue wave 3."
The wave cancellation or invalidation level is set at 200.575, indicating the critical point where the current wave structure could be invalidated, requiring re-evaluation of the analysis.
In summary, the GBP/JPY Elliott Wave Analysis for the Day Chart points to a corrective structure with "blue wave 2" in play within "black wave A of 4." After completing "blue wave 1 of A," the market is in a consolidation phase, with the possibility of a new trend or continued correction in "blue wave 3." The wave cancellation level at 200.575 is a key point to monitor for invalidation of the current wave structure.

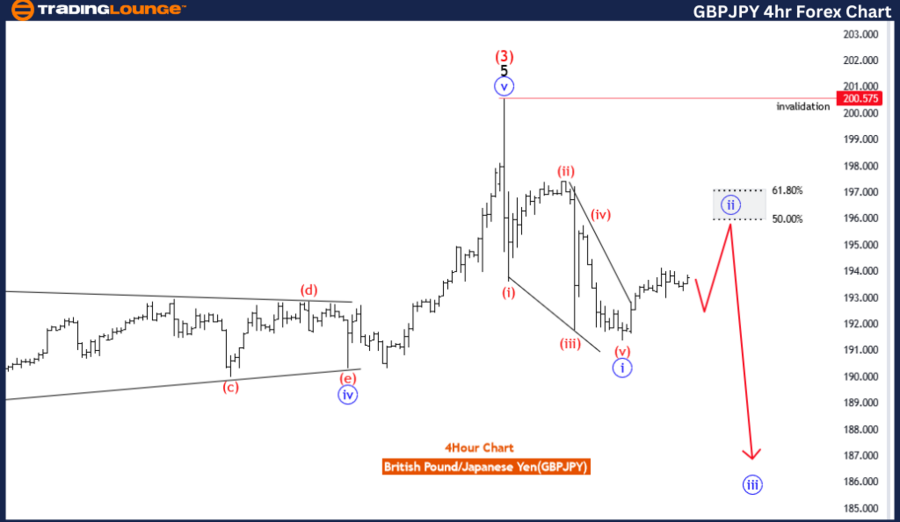
GBPJPY Elliott Wave Analysis Trading Lounge 4-Hour Chart,
British Pound/Japanese Yen(GBPJPY) 4 Hour Chart
GBPJPY Elliott Wave Technical Analysis
FUNCTION: Counter Trend
MODE: Corrective
STRUCTURE: blue wave 2
POSITION: black wave A
DIRECTION NEXT LOWER DEGREES blue wave 3
DETAILS: blue wave 1 of A looking completed at 191.361, now blue wave 2 of A is in play.
Wave Cancel invalid level: 200.575
The GBP/JPY Elliott Wave Analysis for the 4-Hour Chart focuses on the corrective wave patterns currently shaping the movement of the British Pound against the Japanese Yen, indicating the potential for future trends and directional changes.
Function
The function of the analysis is "Counter Trend," indicating that the market is currently in a correction phase, suggesting a deviation from the primary market trend.
Mode
The mode is "Corrective," highlighting that the current wave pattern is a complex, non-linear movement within the broader market structure. Corrective waves often indicate a pause or consolidation before the primary trend resumes.
Structure
The structure is defined as "blue wave 2" within "black wave A," signifying a corrective wave within a larger impulsive wave. This configuration suggests that the market is in the early stages of a potential trend reversal or consolidation before moving into the next phase.
Position
The current position within the wave structure is identified as "black wave A," indicating the start of a new impulsive sequence following a prior correction. This suggests that the market is transitioning into a new phase after completing a correction.
Direction for the Next Lower Degrees
The direction for the next lower degrees is set as "blue wave 3," indicating that once the current corrective wave (blue wave 2) concludes, the market is expected to enter an impulsive movement, signaling a new trend or continuation of the prior trend.
Details
In the details section, the analysis notes that "blue wave 1 of A" is looking completed at 191.361, suggesting that the initial wave within the corrective structure has concluded. Now, "blue wave 2 of A" is in play, indicating that the second wave within the corrective phase is ongoing. This phase could see a period of consolidation or correction before the trend resumes.
The wave cancellation or invalidation level is set at 200.575, signifying a critical threshold. If the market exceeds this level, the current wave structure becomes invalid, requiring a re-evaluation of the wave patterns.
In summary, the GBP/JPY Elliott Wave Analysis for the 4-Hour Chart indicates a corrective structure with "blue wave 2" in play within "black wave A." The analysis shows that after completing "blue wave 1 of A," the market is in a consolidation or corrective phase, with the potential for a new trend following "blue wave 3." The wave cancellation level at 200.575 is a key point to monitor for potential invalidation of the current wave structure.
Technical Analyst: Malik Awais
Source: visit Tradinglounge.com and learn From the Experts Join TradingLounge Here
See Previous: USD/CAD Elliott Wave Analysis
Special Trial Offer - 0.76 Cents a Day for 3 Months! Click here
Access 6 Analysts covering over 150 Markets. Chat Room With Support
