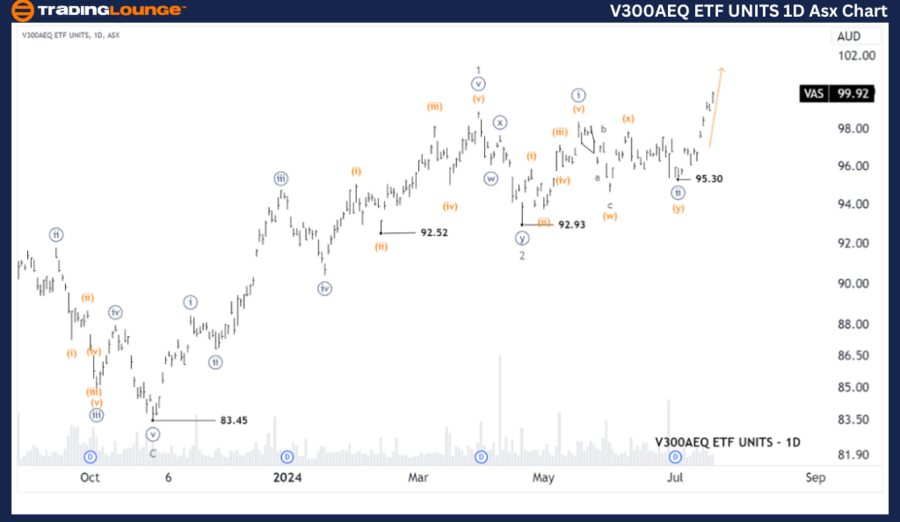
ASX: V300AEQ ETF UNITS – VAS Elliott Wave Technical Analysis (1D Chart)

Greetings, Our Elliott Wave analysis today updates the Australian Stock Exchange (ASX) with V300AEQ ETF UNITS – VAS. We see that VAS.ASX may continue to rise higher than wave ((iii)) - navy of wave 3 - grey.

ASX: V300AEQ ETF UNITS – 1D Chart (Semilog Scale) Analysis

VAS Elliott Wave Technical Analysis

Function: Major trend (Minor degree, grey)

Mode: Motive

Structure: Impulse

Position: Wave ((iii)) - navy

Details:

Wave ((ii)) - navy ended earlier than expected at the low of 95.30. Wave ((iii)) - navy is opening up to push higher. Aim for 110-120 or beyond; while the price must remain above the 95.30 level to sustain this view.

Invalidation point: 95.30

V300AEQ-ETF-UNITS-1D...


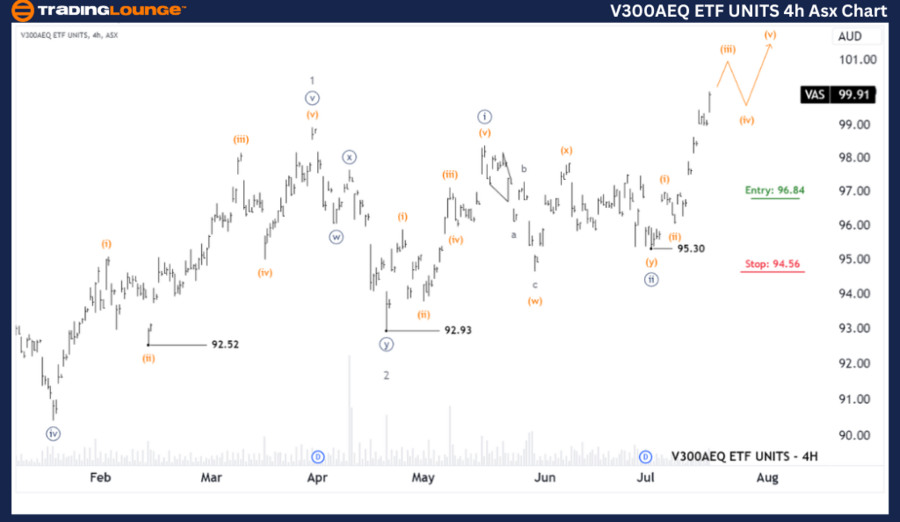
ASX: V300AEQ ETF UNITS – VAS Elliott Wave Technical Analysis (4-Hour Chart)

VAS Elliott Wave Technical Analysis

ASX: V300AEQ ETF UNITS 4-Hour Chart Analysis

Function: Major trend (Minute degree, navy)

Mode: Motive

Structure: Impulse

Position: Wave (iii) - orange of Wave ((iii)) - navy

Details:

Wave ((iii)) - navy is opening up to push higher, subdividing into wave (iii) - orange, which will essentially continue to push higher. Then wave (iv) - orange will pull back down a bit, and finally, wave (v) - orange will return to push higher. The Long Trade position updated at "Stock Check" has generated good profits.

Invalidation point: 95.30

Conclusion

Our analysis, forecast of contextual trends, and short-term outlook for ASX: V300AEQ ETF UNITS – VAS aim to provide readers with insights into the current market trends and how to capitalize on them effectively. We offer specific price points that act as validation or invalidation signals for our wave count, enhancing confidence in our perspective. By combining these factors, we strive to offer readers the most objective and professional perspective on market trends.

Technical Analyst: Hua (Shane) Cuong, CEWA-M (Master’s Designation).

Source: visit Tradinglounge.com and learn From the Experts Join TradingLounge Here 

Previous: ASX: REA GROUP LTD (REA) Elliott Wave Technical Analysis

Special Trial Offer - 0.76 Cents a Day for 3 Months! Click here

Access 7 Analysts Over 170 Markets Covered. Chat Room With Support

V300AEQ-ETF-UNITS-4h...

Related

Elliott Wave Technical Analysis for Walmart Inc. (WMT), Including Detailed Forecasts and Current Price Movements

Elliott Wave Technical Analysis for Walmart Inc. (WMT), Including Detailed Forecasts and Current Price Movements

Explore the most recent Elliott Wave analysis for Walmart Inc. (WMT), including detailed forecasts a...

Read More >
Detailed Cocoa Commodity market Analysis and Cocoa Elliott Wave Technical Analysis Providing Forecast for Cocoa prices

Detailed Cocoa Commodity market Analysis and Cocoa Elliott Wave Technical Analysis Providing Forecast for Cocoa prices

This comprehensive analysis delves into the Cocoa market using Elliott Wave theory. Discover insight...

Read More >
Cochlear Limited Stock Forecast: Elliott Wave Technical Analysis of ASX:COH Reveals Bullish Impulse Setup and Price Targets Ahead

Cochlear Limited Stock Forecast: Elliott Wave Technical Analysis of ASX:COH Reveals Bullish Impulse Setup and Price Targets Ahead

This article presents a professional Elliott Wave analysis for Cochlear Limited (ASX: COH), focusing...

Read More >
Unlocking ASX Trading Success: TELSTRA GROUP LIMITED - TLS Stock Analysis & Elliott Wave Technical Forecast

Unlocking ASX Trading Success: TELSTRA GROUP LIMITED - TLS Stock Analysis & Elliott Wave Technical Forecast

Dive into the latest Telstra Group Limited (TLS.ASX) analysis with Elliott Wave insights. Learn abou...

Read More >
Rigetti Computing RGTI Triangle Breakout Triggers Wave V With Bullish Price Targets Reaching $65 in Latest Elliott Wave Forecast

Rigetti Computing RGTI Triangle Breakout Triggers Wave V With Bullish Price Targets Reaching $65 in Latest Elliott Wave Forecast

This Elliott Wave forecast of Rigetti Computing (RGTI) highlights a bullish Wave V breakout, project...

Read More >
Decline in wheat prices: understand the current market trends with Wheat Commodity Elliott Wave Technical Analysis

Decline in wheat prices: understand the current market trends with Wheat Commodity Elliott Wave Technical Analysis

Explore our comprehensive Wheat Elliott Wave Analysis to understand the current price forecast and m...

Read More >

$1 for 2 Weeks

then $29 a month!

What a Special Offer!

Trade Recommendations

Unleash the power of deversified trading with our comprehensive portfolio, covering 250+ markets:

  • Stock Trades
  • Crypto Trades
  • Forex Trades
  • Commodity Trades
Elliott Wave Analysis

Gain a competitive edge with expert insights and AI-powered Elliott Wave charting into:

  • Global Indices
  • US Stocks & ASX Stocks
  • Forex & Crypto
  • Commodities
Top-Notch Trading Tools

Equip yourself with the tools of success:

  • Real-time Chat rooms
  • Elliott Wave Algorithm
  • Portfolio tools
  • TradingLevels
  • Screener
  • Trading Game
7 Elliott Wave Analysts

Stay ahead of the market with daily charts and insightful videos
Your secret to strategic trading!

JOIN HERE


Welcome to TradingLounge (ASIC A.R.No. 321187), specialists in trades, trading education and technical analysis, covering stocks, indices, commodities, forex and cryptocurrencies.

When you join TradingLounge you have access to everything we offer, including trade tools, educational content and a social platform to chat with like-minded investors.

Read more

@Copyright 2024 by tradinglounge.com

Contact Us

Australian no: 02 4787 6020

International no: +61 (2) 47876020

Pay with:

Find us on