TradingLounge Commodity - Iron Ore Elliott Wave Analysis

Iron Ore Elliott Wave Technical Analysis

The Iron Ore Index serves as a crucial benchmark in the iron ore market, offering valuable insights for traders, miners, and steelmakers who are involved in contract settlements and managing price risks. This index is based on real transactions within the iron ore spot market, making it a reliable indicator of market trends.

In May 2021, the index hit a historic peak of around $233 per dry metric ton, driven by strong demand from China and supply disruptions among key producers. However, this peak triggered a substantial correction, with the index plunging by over 68%, reaching $73 by October 2022. A recovery phase followed, pushing the index up to $143.5 by December 2023. Despite this recovery, 2024 saw another significant decline, with the index dropping nearly 50% before the most recent rebound in September.

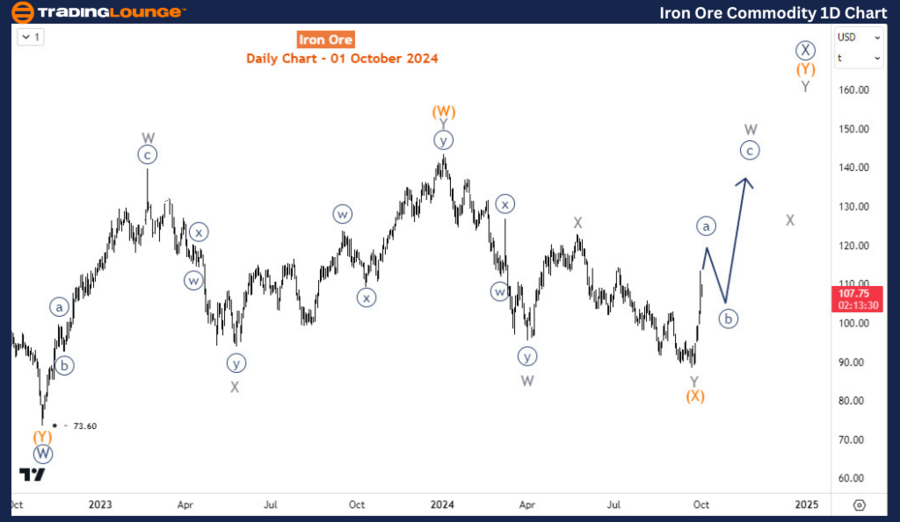
Commodity - Iron Ore Daily Chart Analysis

On the daily chart, we identified the second phase of the bearish correction starting from the all-time high reached in May 2021. The first phase completed wave W (circled) of the primary degree on October 31, 2022, at $73.6. After this, the price formed another bullish zigzag structure, which was completed in January 2024, before the all-year decline began. The decline, however, has been corrective, suggesting a forecast for the second phase higher from $73.6. The most recent rally from the September low indicates that the market could push much higher for wave (Y) of X (circled).

Iron-Ore-Commodity-1...


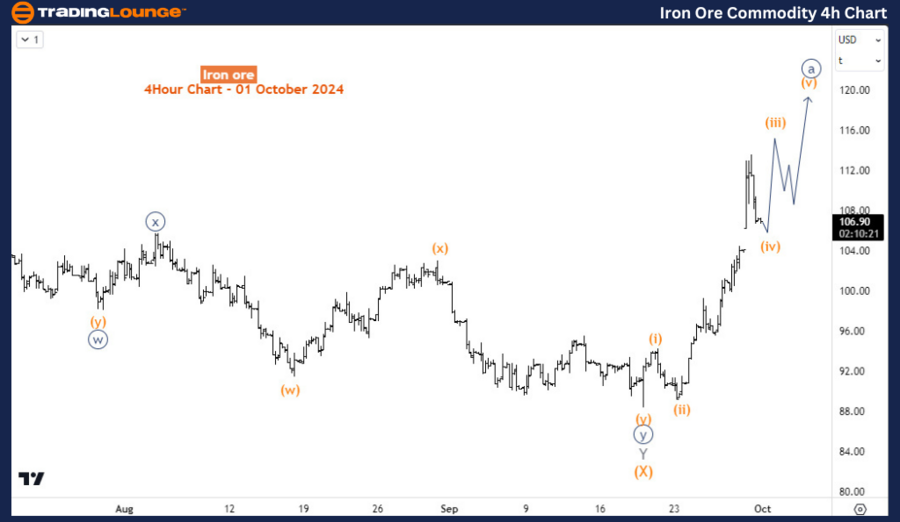
Commodity - Iron Ore H4 Chart Analysis

On the H4 chart, the recovery from the September low forms an impulse wave structure, potentially marking wave ((a)) of W of (Y). This forecast supports further upside in the short and medium term. As long as pullbacks remain above the September low, traders might consider buying the dip for wave ((b)) or X, provided the price aligns with this forecast.

Technical Analyst: Sanmi Adeagbo

Source: visit Tradinglounge.com and learn From the Experts Join TradingLounge Here 

See Previous: Gold Elliott Wave Technical Analysis

VALUE Offer - Buy 1 Month & Get 3 Months!Click here

Access 7 Analysts Over 200 Markets Covered. Chat Room With Support

Iron-Ore-Commodity-4...

Related

Elliott Wave Trading: Strategies for SPX, NDX, and Top Tech Stocks

Elliott Wave Trading: Strategies for SPX, NDX, and Top Tech Stocks

Our post outlines advanced Elliott Wave trading strategies for major indices and tech stocks—includ...

Read More >
Bitcoin/ U.S. dollar(BTCUSD) Elliott Wave Technical Analysis: Potential Impulse Structure Signals Uptrend Momentum

Bitcoin/ U.S. dollar(BTCUSD) Elliott Wave Technical Analysis: Potential Impulse Structure Signals Uptrend Momentum

Discover the most recent BTCUSD analysis utilizing Elliott Wave principles as, signaling bullish mom...

Read More >
Examines the Lululemon athletica Inc. Stock's Current Trend Structure and Price Forecasts based on Elliott Wave Technical Analysis

Examines the Lululemon athletica Inc. Stock's Current Trend Structure and Price Forecasts based on Elliott Wave Technical Analysis

This comprehensive Elliott Wave analysis of Lululemon Athletica Inc. (LULU) examines the stock's...

Read More >
Wheat Commodity Elliott Wave Technical Analysis: Bullish Corrections and Future Price Movements in Wheat Futures

Wheat Commodity Elliott Wave Technical Analysis: Bullish Corrections and Future Price Movements in Wheat Futures

Our latest wheat price forecast for 2024 is based on Elliott Wave analysis, highlighting key market ...

Read More >
Navigating Stock Market Indices with Elliott Wave Analysis: SP500, NASDAQ 100, RUSSELL 2000, and More

Navigating Stock Market Indices with Elliott Wave Analysis: SP500, NASDAQ 100, RUSSELL 2000, and More

This blog explores the current state of major stock market indices, including the S&P 500, NASDAQ 10...

Read More >
Berkshire Hathaway (BRK.B) Elliott Wave Analysis, Stock Forecast, Price Prediction, Trend Outlook & Trading Strategy

Berkshire Hathaway (BRK.B) Elliott Wave Analysis, Stock Forecast, Price Prediction, Trend Outlook & Trading Strategy

Berkshire Hathaway (BRK.B) remains in an impulsive uptrend, currently advancing in wave {iii} of 5. ...

Read More >

$1 for 2 Weeks

then $29 a month!

What a Special Offer!

Trade Recommendations

Unleash the power of deversified trading with our comprehensive portfolio, covering 250+ markets:

  • Stock Trades
  • Crypto Trades
  • Forex Trades
  • Commodity Trades
Elliott Wave Analysis

Gain a competitive edge with expert insights and AI-powered Elliott Wave charting into:

  • Global Indices
  • US Stocks & ASX Stocks
  • Forex & Crypto
  • Commodities
Top-Notch Trading Tools

Equip yourself with the tools of success:

  • Real-time Chat rooms
  • Elliott Wave Algorithm
  • Portfolio tools
  • TradingLevels
  • Screener
  • Trading Game
7 Elliott Wave Analysts

Stay ahead of the market with daily charts and insightful videos
Your secret to strategic trading!

JOIN HERE


Welcome to TradingLounge (ASIC A.R.No. 321187), specialists in trades, trading education and technical analysis, covering stocks, indices, commodities, forex and cryptocurrencies.

When you join TradingLounge you have access to everything we offer, including trade tools, educational content and a social platform to chat with like-minded investors.

Read more

@Copyright 2024 by tradinglounge.com

Contact Us

Australian no: 02 4787 6020

International no: +61 (2) 47876020

Pay with:

Find us on