15Mar

Berkshire Hathaway (BRK.B) Elliott Wave Analysis, Stock Forecast, Price Prediction, Trend Outlook & Trading Strategy

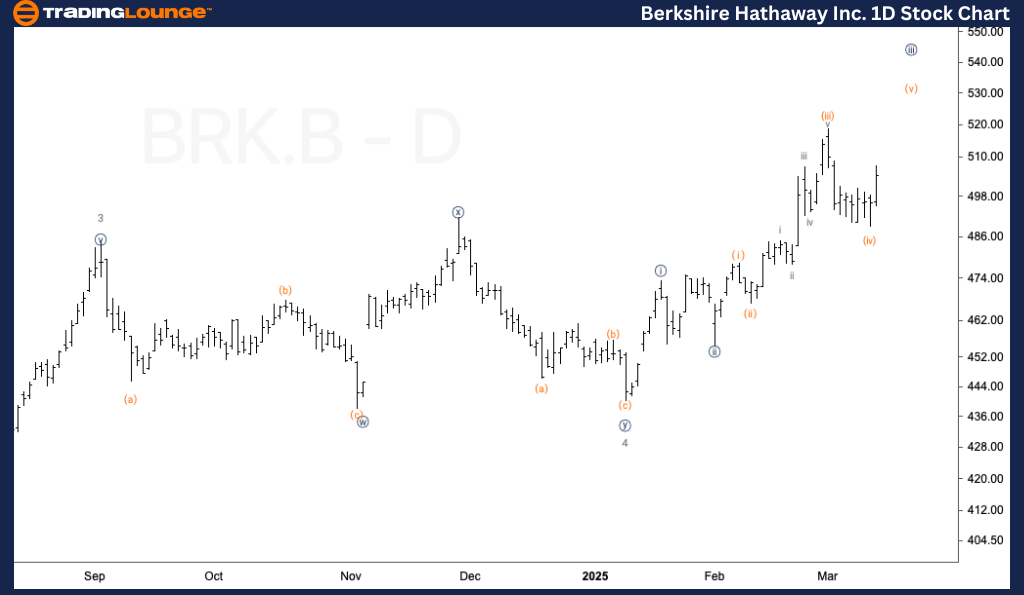
Berkshire Hathaway Inc. (BRK.B) – Elliott Wave Analysis – Trading Lounge Daily Chart

BRK.B Elliott Wave Technical Analysis – Daily Chart

Function: Trend

Mode: Impulsive

Structure: Motive

Position: Wave {iii} of 5

Direction: Upside within wave {iii}

Details:

Berkshire Hathaway (BRK.B) remains in a strong uptrend, currently advancing within wave {iii} of the larger wave 5 structure. The recent three-wave corrective pattern (wave iv) has likely completed, paving the way for further bullish movement.

Key support at $500 must hold to confirm continued upside momentum and validate the ongoing impulsive trend. A sustained break above this level strengthens the bullish outlook for wave {iii}.

Market Outlook for BRK.B Daily Chart Analysis:

BRK.B remains in an impulsive uptrend, currently advancing within wave {iii} of 5.
The completion of wave iv suggests further upside potential, reinforcing the bullish case for wave {iii}.
Holding above $500 is key for sustained bullish momentum, with a successful support test confirming continued upside movement toward the next resistance zones.

Berkshire-Hathaway-I...


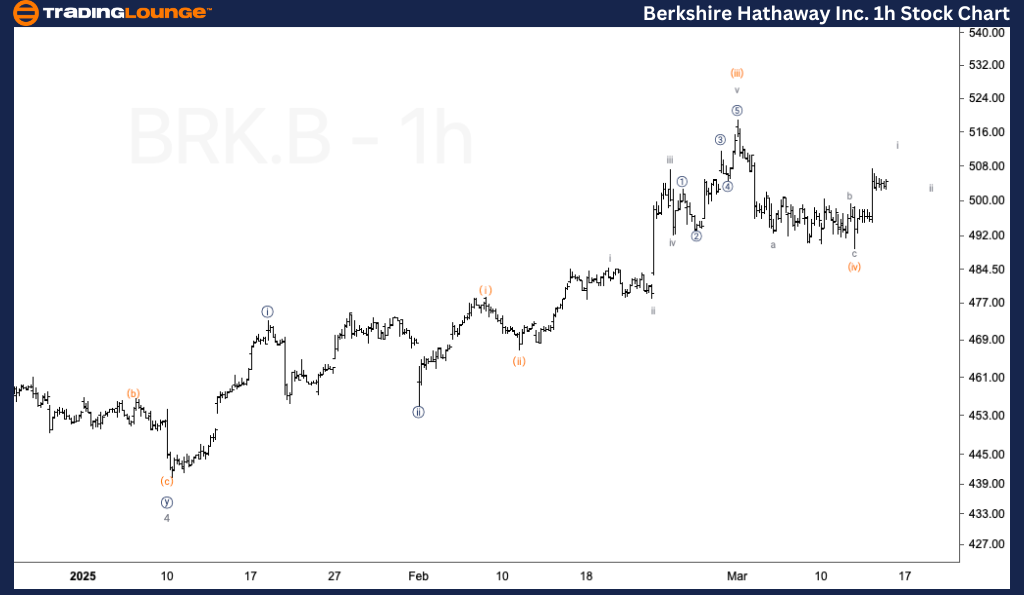
Berkshire Hathaway Inc. (BRK.B) – Elliott Wave Analysis – Trading Lounge 1-Hour Chart

Function: Trend

Mode: Impulsive

Structure: Motive

Position: Wave i of (v)

Direction: Upside in wave (v)

Details:

The 1-hour chart indicates that BRK.B is progressing within wave (v), with an expected final leg higher in micro wave 5 of subminuette wave i.

A minor pullback in wave ii is anticipated around the $500 support level before the next bullish phase resumes in wave (v). This dip could provide a buying opportunity for traders looking to align with the broader uptrend.

Market Outlook for BRK.B 1-Hour Chart Analysis:

A final leg higher in micro wave 5 of subminuette wave i is expected.
A minor pullback in wave ii near $500 could act as a setup for the next rally in wave (v).
As long as price action remains above $500, the bullish trend remains intact.
Traders should watch price reactions near the $500 level, as it serves as a key pivot for the next phase of the Elliott Wave structure.

Technical Analyst: Malik Awais

Source: Visit Tradinglounge.com and learn from the Experts. Join TradingLounge Here 

Previous: Dell Technologies Inc. (DELL) Elliott Wave Technical Analysis

VALUE Offer - Buy 1 Month & Get 3 Months!Click here

Access 7 Analysts Over 200 Markets Covered. Chat Room With Support

Berkshire-Hathaway-I...

Related

Berkshire Hathaway Inc.(BRK.B:NYSE) Elliott Wave Technical Analysis 22 November 23

Berkshire Hathaway Inc.(BRK.B:NYSE) Elliott Wave Technical Analysis 22 November 23

Stock Berkshire Hathaway Inc.(BRK.B: NYSE) Elliott Wave Technical Analysis 1-hour and 4-hour Chart d...

Read More >
Australian Dollar / Japanese Yen(AUDJPY) Elliott Wave Technical Analysis 24 November 23

Australian Dollar / Japanese Yen(AUDJPY) Elliott Wave Technical Analysis 24 November 23

The AUDJPY Elliott Wave Analysis Trading Lounge Day Chart dated 24 November 23, provides a comprehen...

Read More >
U.S. Dollar/Swiss Franc (USDCHF) Forex Elliott Wave Technical Analysis identifies the Corrective Phase and Anticipates Future Moves

U.S. Dollar/Swiss Franc (USDCHF) Forex Elliott Wave Technical Analysis identifies the Corrective Phase and Anticipates Future Moves

Our USDCHF Elliott Wave Analysis provides an in-depth look at the current market trends and wave str...

Read More >
Euro/ U.S. Dollar (EURUSD) Elliott Wave Technical Analysis - Confirming a Bullish Trend with Impulse Waves in Play

Euro/ U.S. Dollar (EURUSD) Elliott Wave Technical Analysis - Confirming a Bullish Trend with Impulse Waves in Play

This EURUSD Elliott Wave analysis provides a detailed forecast of price movements, confirming a bull...

Read More >
Our analysis includes daily and 4-hour chart insights: NVIDIA Corp.(NVDA) Stocks Elliott Wave Technical Analysis

Our analysis includes daily and 4-hour chart insights: NVIDIA Corp.(NVDA) Stocks Elliott Wave Technical Analysis

Explore our detailed NVIDIA Elliott Wave Analysis to understand the current and potential future mov...

Read More >
Asian Paints Elliott Wave Analysis Reveals Bullish Trend Initiation with Critical Support and Potential Upward Price Movement

Asian Paints Elliott Wave Analysis Reveals Bullish Trend Initiation with Critical Support and Potential Upward Price Movement

The Elliott Wave analysis of Asian Paints indicates the formation of Orange Wave 1 within Navy Blue ...

Read More >

$1 for 2 Weeks

then $29 a month!

What a Special Offer!

Trade Recommendations

Unleash the power of deversified trading with our comprehensive portfolio, covering 250+ markets:

  • Stock Trades
  • Crypto Trades
  • Forex Trades
  • Commodity Trades
Elliott Wave Analysis

Gain a competitive edge with expert insights and AI-powered Elliott Wave charting into:

  • Global Indices
  • US Stocks & ASX Stocks
  • Forex & Crypto
  • Commodities
Top-Notch Trading Tools

Equip yourself with the tools of success:

  • Real-time Chat rooms
  • Elliott Wave Algorithm
  • Portfolio tools
  • TradingLevels
  • Screener
  • Trading Game
7 Elliott Wave Analysts

Stay ahead of the market with daily charts and insightful videos
Your secret to strategic trading!

JOIN HERE


Welcome to TradingLounge (ASIC A.R.No. 321187), specialists in trades, trading education and technical analysis, covering stocks, indices, commodities, forex and cryptocurrencies.

When you join TradingLounge you have access to everything we offer, including trade tools, educational content and a social platform to chat with like-minded investors.

Read more

@Copyright 2024 by tradinglounge.com

Contact Us

Australian no: 02 4787 6020

International no: +61 (2) 47876020

Pay with:

Find us on