Cocoa Elliott Wave Analysis - 1 March 24

Cocoa Elliott Wave Technical Analysis

Function - Trend

Mode - Impulsive

Structure - Impulse Wave

Position - Blue wave ‘iv’ unfolds

Direction - Blue wave ‘iv’ in progress

Cocoa has been a standout performer in the commodity market over the past two years, exhibiting a robust upward trend since September 2022. During this period, Cocoa prices have surged by an impressive 170%, following a discernible impulse wave pattern.

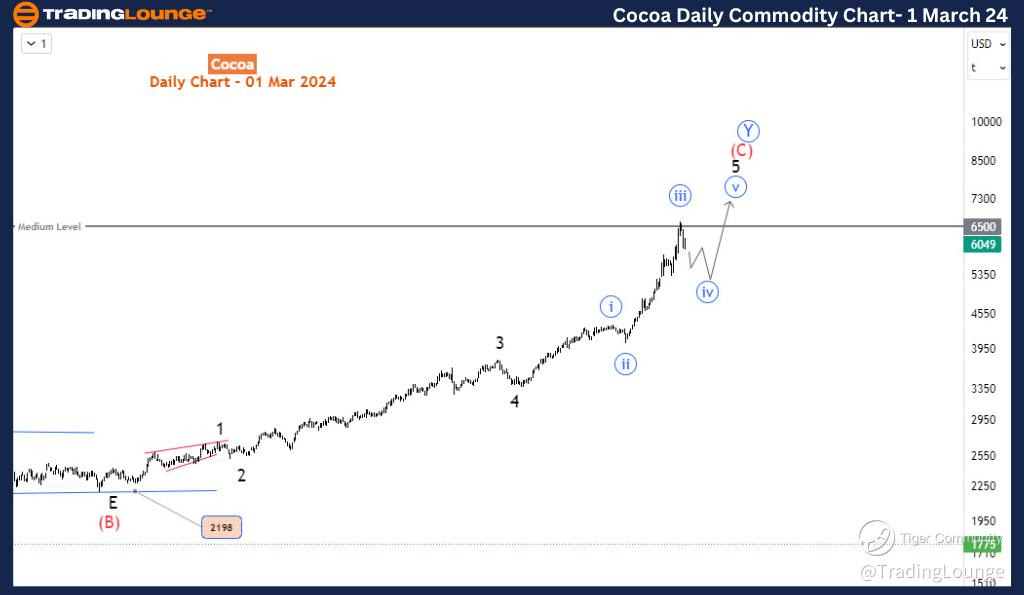
Cocoa Day Chart Analysis

Examining the daily chart, it is evident that the current rally, which commenced around the 2200 mark, is approaching its final stages. The completion of black wave 5 marked the conclusion of blue sub-wave iii at 6500. The recent downward movement indicates the emergence of blue sub-wave iv. Based on projections, blue sub-wave iv of 5 is anticipated to progress towards the significant level of 8000.

Cocoa-day-commodity-...


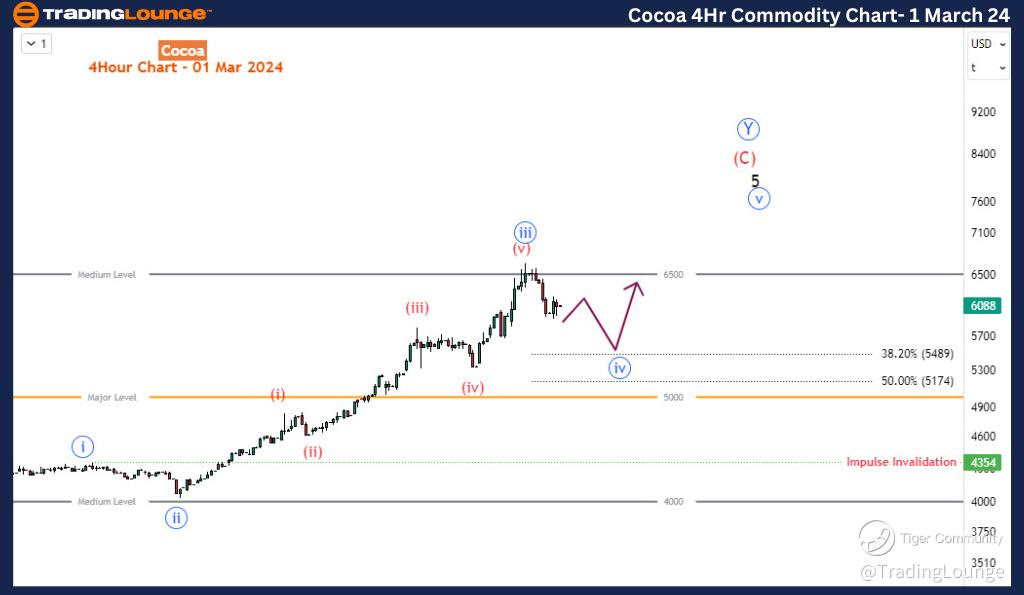
Cocoa 4-Hour Chart Analysis

A closer inspection of the sub-waves within blue wave iv reveals a potential three-wave decline, as depicted on the H4 chart. This decline from 6500 is forecasted to retrace towards the Fibonacci levels of 5489-5174. Additionally, the critical trading level of 5000 serves as another pivotal area to monitor for potential support should the ongoing dip breach the aforementioned Fibonacci zone. However, it's essential to note that the development of the wave 5 impulse pattern would be invalidated if prices were to fall below 4354.

In summary, adopting a strategy of buying into the dip appears to be the most prudent approach for traders interested in Cocoa. The focus will be on purchasing opportunities towards the end of blue wave iv of 5, particularly if there's a bullish reaction observed at the identified price support levels.

This analysis underscores the potential opportunities within Cocoa's current price movement and provides a framework for traders to navigate the market effectively. By incorporating Elliott Wave principles, traders can better understand the underlying market dynamics and make informed decisions to capitalize on future price movements in Cocoa.

Technical Analyst: Sanmi Adeagbo

Source: visit Tradinglounge.com and learn From the Experts Join TradingLounge Here 

See Previous: Gold (XAUUSD)

TradingLounge Once Off SPECIAL DEAL: Here > 1 month Get 3 months.   

Cocoa-4hr-commodity-...

Related

Euro/British Pound(EURGBP) Elliott Wave Technical Analysis 30 November 23

Euro/British Pound(EURGBP) Elliott Wave Technical Analysis 30 November 23

EURGBP Elliott Wave Analysis Trading Lounge Day Chart dated 30 November 23, provides an insightful e...

Read More >
S&P 500 Elliott Wave Analysis with Daily and Weekly Charts Highlighting Impulsive Trends, Wave Counts, and Market Forecasts

S&P 500 Elliott Wave Analysis with Daily and Weekly Charts Highlighting Impulsive Trends, Wave Counts, and Market Forecasts

S&P 500 Elliott Wave analysis on both daily and weekly timeframes. It outlines the current market po...

Read More >
ITC INDIA Stock's Bullish Momentum: Elliott Wave Analysis Reveals Key Trends, Wave Counts, and Investment Opportunities Ahead

ITC INDIA Stock's Bullish Momentum: Elliott Wave Analysis Reveals Key Trends, Wave Counts, and Investment Opportunities Ahead

ITC's stock performance through the lens of Elliott Wave Theory, highlighting a bullish trend wi...

Read More >
Theta Token/ U.S. dollar(THETAUSD) Elliott Wave Technical Analysis 8 December 23

Theta Token/ U.S. dollar(THETAUSD) Elliott Wave Technical Analysis 8 December 23

Theta Token/ U.S. dollar(THETAUSD) Elliott Wave Technical Analysis dated 8 December 23, Theta Token ...

Read More >
Visa Inc. (V) Stock Analysis: Elliott Wave Insights, Price Forecasts & Trading Trends with Daily and Hourly Chart Breakdowns

Visa Inc. (V) Stock Analysis: Elliott Wave Insights, Price Forecasts & Trading Trends with Daily and Hourly Chart Breakdowns

Explore Visa stock trends and forecasts through Elliott Wave Analysis. Learn about Visa's bullis...

Read More >
Euro/U.S. Dollar (EURUSD) Elliott Wave Forecast: Orange Wave 5 Impulse with Gray Wave 2 Correction & 1.10651 Invalidation Key

Euro/U.S. Dollar (EURUSD) Elliott Wave Forecast: Orange Wave 5 Impulse with Gray Wave 2 Correction & 1.10651 Invalidation Key

Elliott Wave breakdown for EURUSD: Daily chart shows impulsive Orange Wave 5 within Navy Blue Wave 1...

Read More >

$1 for 2 Weeks

then $29 a month!

What a Special Offer!

Trade Recommendations

Unleash the power of deversified trading with our comprehensive portfolio, covering 250+ markets:

  • Stock Trades
  • Crypto Trades
  • Forex Trades
  • Commodity Trades
Elliott Wave Analysis

Gain a competitive edge with expert insights and AI-powered Elliott Wave charting into:

  • Global Indices
  • US Stocks & ASX Stocks
  • Forex & Crypto
  • Commodities
Top-Notch Trading Tools

Equip yourself with the tools of success:

  • Real-time Chat rooms
  • Elliott Wave Algorithm
  • Portfolio tools
  • TradingLevels
  • Screener
  • Trading Game
7 Elliott Wave Analysts

Stay ahead of the market with daily charts and insightful videos
Your secret to strategic trading!

JOIN HERE


Welcome to TradingLounge (ASIC A.R.No. 321187), specialists in trades, trading education and technical analysis, covering stocks, indices, commodities, forex and cryptocurrencies.

When you join TradingLounge you have access to everything we offer, including trade tools, educational content and a social platform to chat with like-minded investors.

Read more

@Copyright 2024 by tradinglounge.com

Contact Us

Australian no: 02 4787 6020

International no: +61 (2) 47876020

Pay with:

Find us on