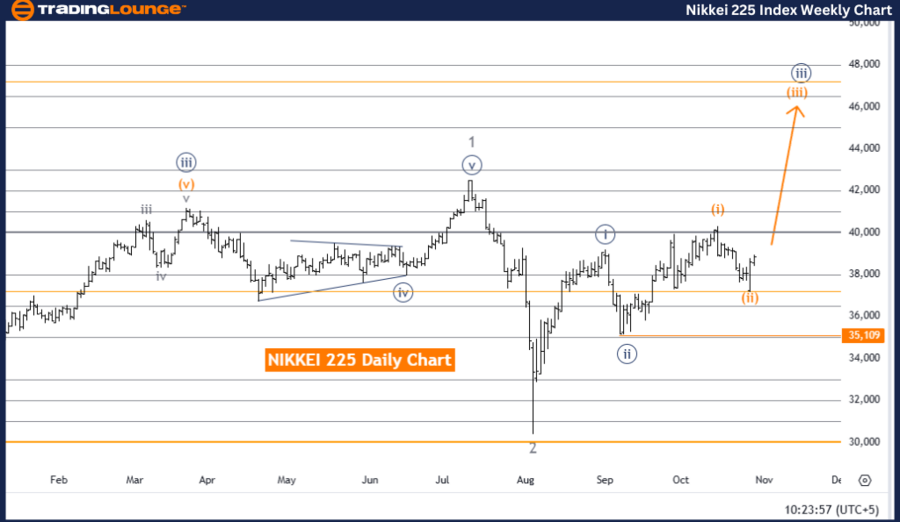
Nikkei 225 (N225) Elliott Wave Analysis - Trading Lounge Daily Chart
Nikkei 225 (N225) Elliott Wave Technical Analysis
Function: Bullish Trend
Mode: Impulsive
Structure: Orange Wave 3
Position: Navy Blue Wave 3
Direction Next Higher Degrees: Orange Wave 3 (Initiated)
Details: Completion of orange wave 2 indicates orange wave 3 has commenced.
Wave Cancel Invalid Level: 35,109
The daily Nikkei 225 (N225) Elliott Wave analysis shows a bullish trend underpinned by an impulsive structure in orange wave 3, which fits within the broader cycle of navy blue wave 3. This structure points toward continued upward momentum, with orange wave 3 actively moving forward within navy blue wave 3, enhancing the bullish outlook for Nikkei 225.
The current phase, orange wave 3, characterized by its impulsive wave nature, aligns well with a strong bullish sentiment, signaling a robust upward push for Nikkei 225. The preceding orange wave 2’s completion confirms this new bullish phase in orange wave 3, suggesting potential for a continued rally as the index advances in line with the upward trend.
Higher degree trends remain aligned with orange wave 3, which is newly underway within the overarching Elliott Wave sequence. The trend indicates potential for further gains, albeit with occasional minor pullbacks. However, the overall trajectory remains positive.
The critical reference level, set at 35,109, serves as an invalidation point. If Nikkei 225 dips below this level, it would invalidate the current bullish wave count, suggesting a possible shift in trend. Until then, as long as the index remains above this level, the current bullish wave structure holds.
Summary:
The daily Nikkei 225 chart analysis signals a bullish trend within orange wave 3 of navy blue wave 3. With orange wave 3 in progress and maintaining strong momentum, this analysis favors continued gains, setting 35,109 as the key level for invalidating the current bullish trend.
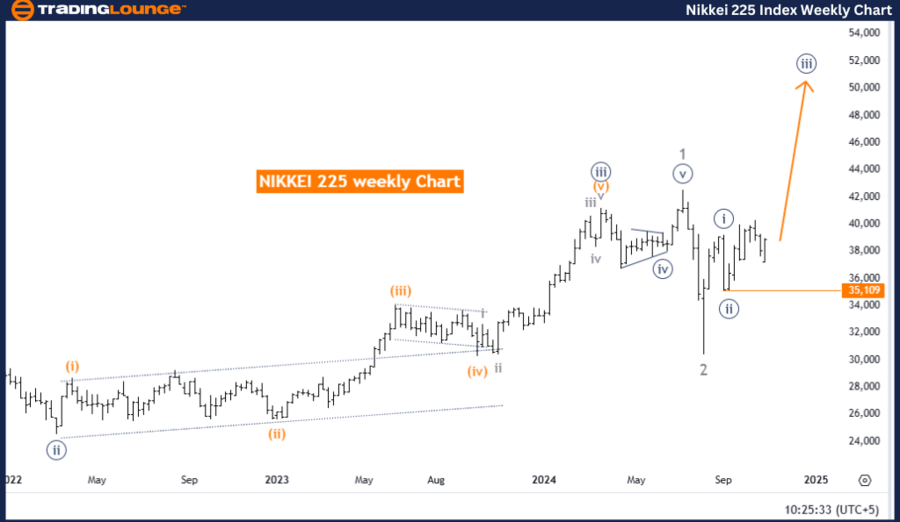
Nikkei 225 (N225) Elliott Wave Analysis - Trading Lounge Weekly Chart
Nikkei 225 (N225) Elliott Wave Technical Analysis
Function: Bullish Trend
Mode: Impulsive
Structure: Navy Blue Wave 3
Position: Gray Wave 3
Direction Next Higher Degrees: Navy Blue Wave 3 (Progressing)
Details: Navy blue wave 2 appears complete; navy blue wave 3 is now advancing.
Wave Cancel Invalid Level: 35,109
The weekly Nikkei 225 (N225) Elliott Wave analysis reveals a bullish trend with an impulsive structure in navy blue wave 3, a segment of the larger gray wave 3. This structure highlights consistent upward momentum, as navy blue wave 3 is building on the foundation laid by the completed navy blue wave 2.
With navy blue wave 3 currently progressing, this phase signifies a significant upward trajectory in the Elliott Wave cycle, supporting a strong bullish forecast for Nikkei 225. The impulsive nature of navy blue wave 3 implies further price gains, marked by a series of higher highs and higher lows, reinforcing bullish market sentiment.
The ongoing higher-degree trend remains aligned with navy blue wave 3’s upward movement, indicating a positive trajectory in this wave structure. This also affirms a long-term bullish trend in Nikkei 225, as gray wave 3 continues to develop.
The critical reference level for this wave structure is 35,109, serving as the threshold for invalidation. Should the index fall below this level, the current wave count would be invalid, necessitating a trend reevaluation. However, as long as prices stay above this key level, the bullish wave count remains intact, supporting the continuation of the current upward trend.
Summary:
The weekly Nikkei 225 analysis illustrates a robust bullish trend within navy blue wave 3, embedded in gray wave 3, with expectations of further upward movement. This ongoing trend remains valid as long as levels hold above 35,109, signaling potential gains as the bullish Elliott Wave structure endures.
Technical Analyst: Malik Awais
Source: visit Tradinglounge.com and learn From the Experts Join TradingLounge Here
Previous: Russell 2000 Elliott Wave Technical Analysis
VALUE Offer - Buy 1 Month & Get 3 Months!Click here
Access 7 Analysts Over 200 Markets Covered. Chat Room With Support