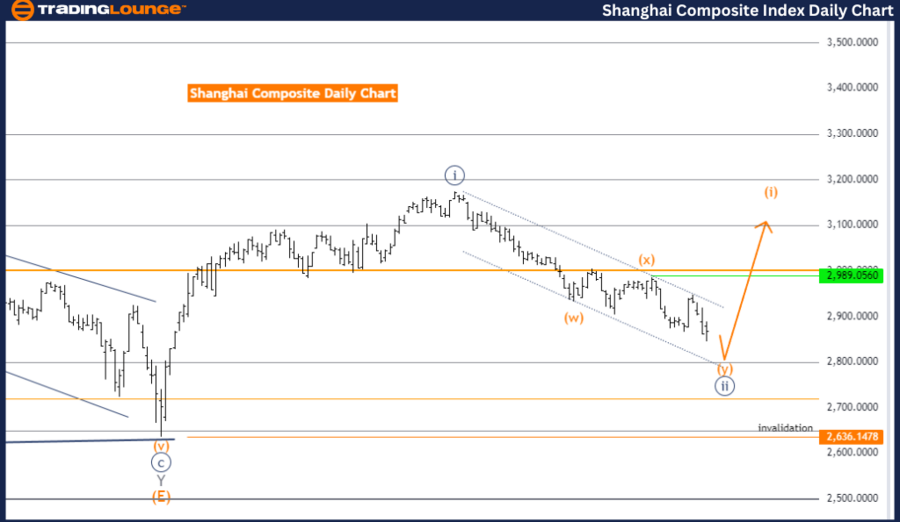
Shanghai Composite Elliott Wave Analysis Trading Lounge Day Chart
Shanghai Composite Elliott Wave Technical Analysis
Function: Counter Trend
Mode: Corrective
Structure: Navy Blue Wave 2
Position: Gray Wave 1
Direction Next Higher Degrees: Orange Wave 1 of 3
Details: Navy Blue Wave 2 is still in play and nearing its end.
Wave Cancel Invalid Level: 2636.1478
The daily chart analysis of the Shanghai Composite shows the market in a counter-trend mode. Identified wave structure, Navy Blue Wave 2, signifies a corrective phase within the broader trend. This phase suggests a market retracement or consolidation before potentially resuming its primary trend direction.
The current position is Gray Wave 1, indicating the start of a new wave sequence after Navy Blue Wave 2 completes. Navy Blue Wave 2 is still active and nearing completion, implying the corrective phase is almost over, and a new impulsive phase might begin soon.
The next higher degree direction is Orange Wave 1 of 3. Once Navy Blue Wave 2 ends, the market is expected to enter Orange Wave 1, starting a new upward impulsive sequence. The end of Navy Blue Wave 2 is critical as it sets the stage for the next major market move.
The wave cancel invalid level is set at 2636.1478. This level is crucial as it serves as a threshold for the current wave count. If the index falls below this level, the current wave structure becomes invalid, meaning the anticipated end of Navy Blue Wave 2 and start of Orange Wave 1 may not occur. A reevaluation of the wave count and market outlook would then be necessary.
In summary, the daily chart analysis shows the market in a corrective phase with Navy Blue Wave 2 nearing its end. The next expected move is the start of Orange Wave 1, signaling a new upward impulsive phase. The wave cancel invalid level at 2636.1478 is vital for maintaining the validity of the current wave structure. A breach of this level requires reassessment of the wave count and market direction.
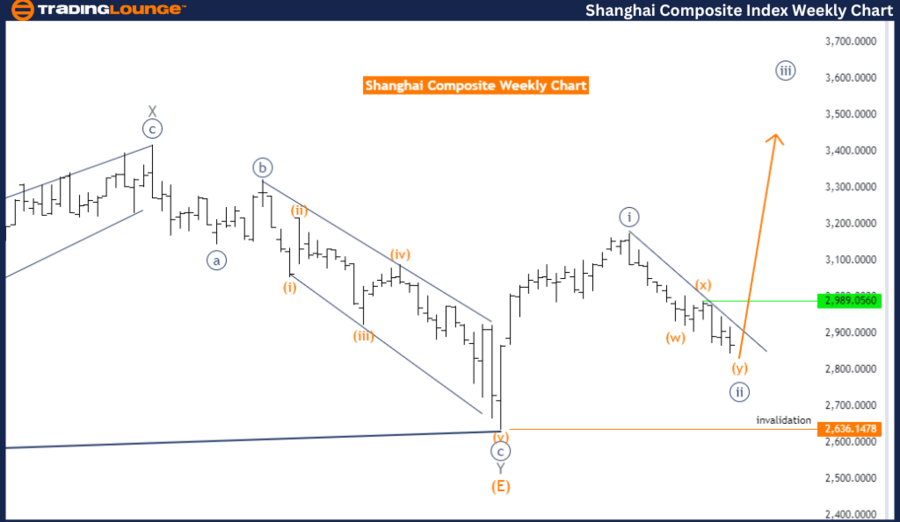
Shanghai Composite Elliott Wave Analysis Trading Lounge Weekly Chart
Shanghai Composite Elliott Wave Technical Analysis
Function: Counter Trend
Mode: Corrective
Structure: Navy Blue Wave 2
Position: Gray Wave 1
Direction Next Higher Degrees: Navy Blue Wave 3
Details: Navy Blue Wave 2 is still in play and nearing its end.
Wave Cancel Invalid Level: 2636.1478
The weekly chart analysis of the Shanghai Composite shows the market in a counter-trend mode. The identified wave structure, Navy Blue Wave 2, signifies a corrective phase within a larger trend. This phase indicates the market is experiencing a retracement or consolidation before potentially continuing in its primary trend direction.
The current position is Gray Wave 1, indicating the early stages of a new wave sequence following Navy Blue Wave 2. Navy Blue Wave 2 is still in progress and nearing its end, implying the corrective phase is almost over, and a new impulsive phase might begin soon.
The next higher degree direction is Navy Blue Wave 3. Once Navy Blue Wave 2 concludes, the market is expected to enter Navy Blue Wave 3, initiating a new upward impulsive sequence. The end of Navy Blue Wave 2 is critical as it sets the stage for the next major market move.
The wave cancel invalid level is set at 2636.1478. This level is significant as it serves as a threshold for the current wave count. If the index drops below this level, the current wave structure becomes invalid, meaning the anticipated end of Navy Blue Wave 2 and start of Navy Blue Wave 3 may not occur. A reevaluation of the wave count and market outlook would then be necessary.
In summary, the weekly chart analysis shows the market in a corrective phase with Navy Blue Wave 2 nearing its end. The next expected move is the start of Navy Blue Wave 3, signaling a new upward impulsive phase. The wave cancel invalid level at 2636.1478 is vital for maintaining the validity of the current wave structure. A breach of this level requires reassessment of the wave count and market direction.
Technical Analyst: Malik Awais
Source: visit Tradinglounge.com and learn From the Experts Join TradingLounge Here
See previous: DJI Elliott Wave Technical Analysis
Special Trial Offer - 0.76 Cents a Day for 3 Months! Click here
Access 7 Analysts Over 170 Markets Covered. Chat Room With Support