ASX: V300AEQ ETF UNITS – VAS Elliott Wave Analysis TradingLounge (1D Chart)

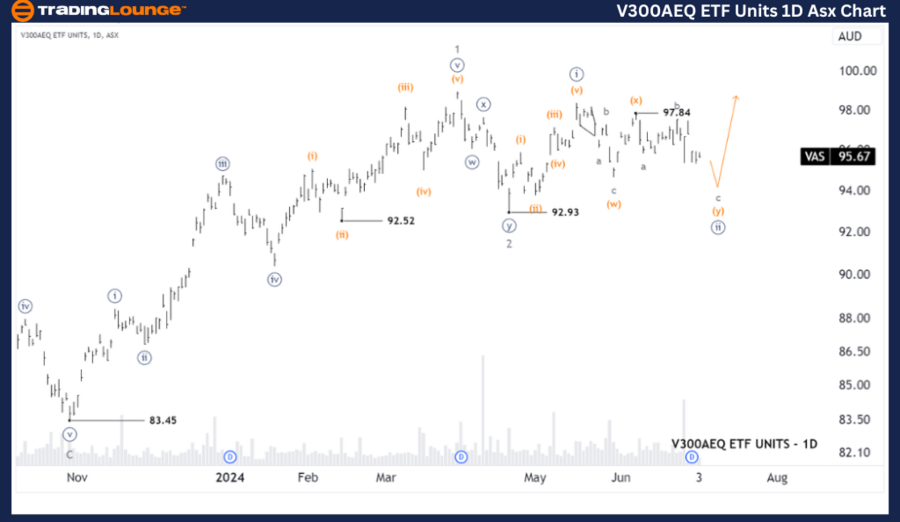
Greetings, our Elliott Wave analysis today updates the Australian Stock Exchange (ASX) with V300AEQ ETF UNITS – VAS. We observe that wave 2-grey has concluded, and wave 3-grey is unfolding, pushing higher. Subwaves are developing as wave ((i)), and wave ((ii))-navy appears to be nearing completion, allowing wave ((iii))-navy to push higher later.

ASX: V300AEQ ETF UNITS – VAS Elliott Wave Technical Analysis

ASX: V300AEQ ETF UNITS – VAS 1D Chart (Semilog Scale) Analysis

Function: Major trend (Minor degree, grey)

Mode: Motive

Structure: Impulse

Position: Wave c-grey of Wave (y)-orange of Wave ((ii))-navy

Details: The short-term outlook shows that wave ((ii))-navy is lasting longer than expected, unfolding as a Double Zigzag. Wave (y)-orange seems to be nearing completion, and will be followed by wave ((iii))-navy pushing higher.

Invalidation point: 92.93

V300AEQ-ETF-UNITS-1D...


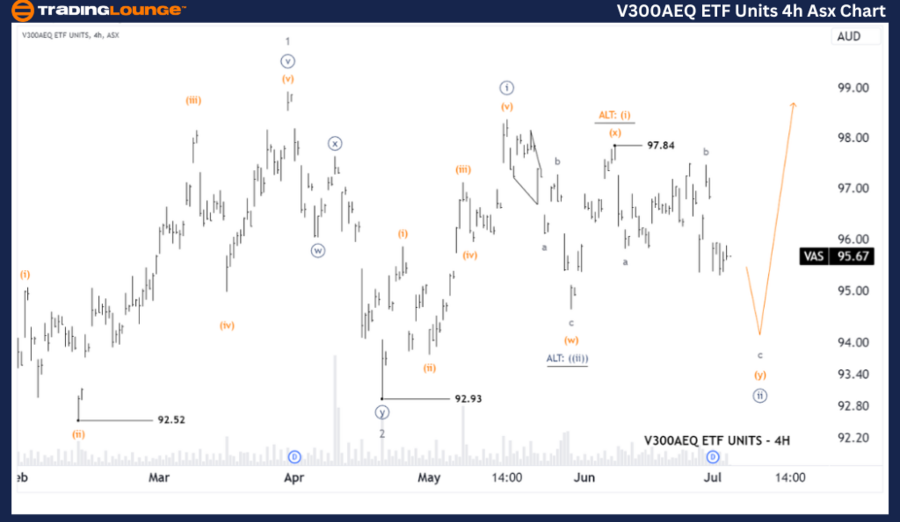
ASX: V300AEQ ETF UNITS – VAS Elliott Wave Analysis TradingLounge (4-Hour Chart)

ASX: V300AEQ ETF UNITS – VAS Elliott Wave Technical Analysis

ASX: V300AEQ ETF UNITS – VAS 4-Hour Chart Analysis

Function: Major trend (Minute degree, navy)

Mode: Motive

Structure: Impulse

Position: Wave c-grey of Wave (y)-orange of Wave ((ii))-navy

Details: The shorter-term outlook shows wave ((ii))-navy developing as a Double Zigzag. Wave (y)-orange is unfolding as an ABC Zigzag, with waves a,b-grey completed, and wave c-grey continuing to push lower. After wave ((ii))-navy completes, wave ((iii))-navy will push even higher.

Invalidation point: 92.93

Technical Analyst: Hua (Shane) Cuong, CEWA-M (Master’s Designation).

Source: visit Tradinglounge.com and learn From the Experts Join TradingLounge Here 

Previous: SANTOS LIMITED - STO Elliott Wave Technical Analysis

Special Trial Offer - 0.76 Cents a Day for 3 Months! Click here

Access 7 Analysts Over 170 Markets Covered. Chat Room With Support

V300AEQ-ETF-UNITS-4h...

Conclusion

Our analysis and forecast of contextual trends, along with the short-term outlook for ASX: V300AEQ ETF UNITS – VAS, aim to provide insights into the current market trends and how to capitalize on them effectively. We offer specific price points that act as validation or invalidation signals for our wave count, enhancing confidence in our perspective. Combining these factors, we strive to offer the most objective and professional perspective on market trends.

Related

Maruti Suzuki Stock Analysis: Elliott Wave Trends, Daily and 4H Chart Patterns, Resistance Levels, and Price Movement Insights

Maruti Suzuki Stock Analysis: Elliott Wave Trends, Daily and 4H Chart Patterns, Resistance Levels, and Price Movement Insights

Maruti Suzuki's stock is currently showing potential trend reversals and price movements based o...

Read More >
Elliott Wave Analysis and Trading Strategies for NASDAQ and Major Tech Stocks

Elliott Wave Analysis and Trading Strategies for NASDAQ and Major Tech Stocks

This week, our Elliott Wave analysis tracks two bullish counts for the NASDAQ 100 (NDX) and key tech...

Read More >
Impulse Wave iii) Topping—Elliott Wave Analysis of Major Indices and Tech Stocks

Impulse Wave iii) Topping—Elliott Wave Analysis of Major Indices and Tech Stocks

The strong upward movement in major stock indices and tech stocks suggests that impulse wave iii) ma...

Read More >
United Health Group Inc.(UNH:NYSE) Elliott Wave Technical Analysis 19 December 23

United Health Group Inc.(UNH:NYSE) Elliott Wave Technical Analysis 19 December 23

United Health Group Inc.(UNH: NYSE) Elliott Wave Technical Analysis 4-hour and 1-hour Chart dated 19...

Read More >
Corn Commodity Elliott Wave Technical Analysis: Gain Insights into Potential Price Movements and Market Correction

Corn Commodity Elliott Wave Technical Analysis: Gain Insights into Potential Price Movements and Market Correction

This article provides a comprehensive analysis of Corn prices using Elliott Wave theory. It covers t...

Read More >
Elliott Wave Technical Analysis of Bovespa Index: Bullish Trends, Key Levels, Wave Structures, and Insights for Traders’ Market Gains.

Elliott Wave Technical Analysis of Bovespa Index: Bullish Trends, Key Levels, Wave Structures, and Insights for Traders’ Market Gains.

This article provides an in-depth Elliott Wave analysis of the Bovespa Index, showcasing a bullish t...

Read More >

$1 for 2 Weeks

then $29 a month!

What a Special Offer!

Trade Recommendations

Unleash the power of deversified trading with our comprehensive portfolio, covering 250+ markets:

  • Stock Trades
  • Crypto Trades
  • Forex Trades
  • Commodity Trades
Elliott Wave Analysis

Gain a competitive edge with expert insights and AI-powered Elliott Wave charting into:

  • Global Indices
  • US Stocks & ASX Stocks
  • Forex & Crypto
  • Commodities
Top-Notch Trading Tools

Equip yourself with the tools of success:

  • Real-time Chat rooms
  • Elliott Wave Algorithm
  • Portfolio tools
  • TradingLevels
  • Screener
  • Trading Game
7 Elliott Wave Analysts

Stay ahead of the market with daily charts and insightful videos
Your secret to strategic trading!

JOIN HERE


Welcome to TradingLounge (ASIC A.R.No. 321187), specialists in trades, trading education and technical analysis, covering stocks, indices, commodities, forex and cryptocurrencies.

When you join TradingLounge you have access to everything we offer, including trade tools, educational content and a social platform to chat with like-minded investors.

Read more

@Copyright 2024 by tradinglounge.com

Contact Us

Australian no: 02 4787 6020

International no: +61 (2) 47876020

Pay with:

Find us on