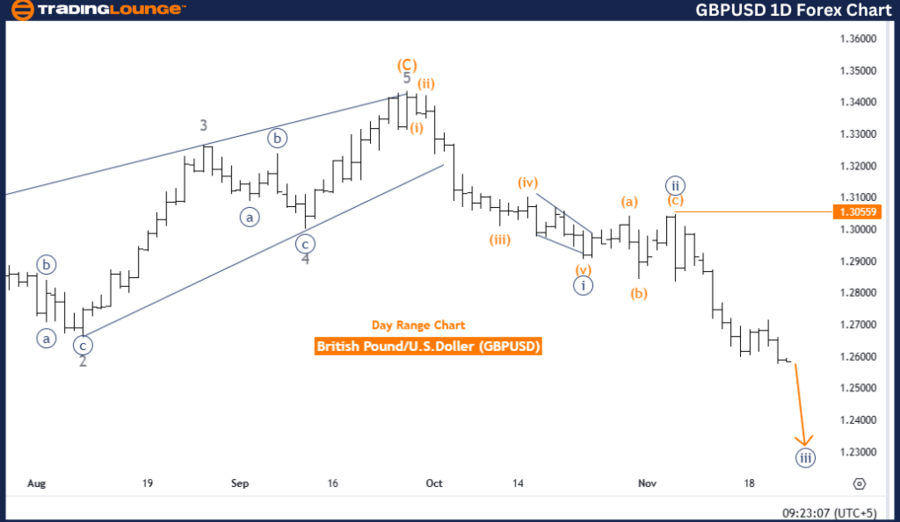
GBPUSD Elliott Wave Analysis: Trading Lounge Day Chart
British Pound/U.S. Dollar (GBPUSD) Day Chart Analysis
GBPUSD Elliott Wave Technical Analysis
Function: Bearish Trend
Mode: Impulsive
Structure: Navy Blue Wave 3
Position: Gray Wave 1
Direction (Next Higher Degrees): Navy Blue Wave 4
Details The analysis indicates that navy blue wave 2 has likely concluded, with navy blue wave 3 currently developing.
Wave Cancel Invalidation Level: 1.30559
Forex Market Analysis Overview
This Elliott Wave analysis examines the GBPUSD pair on a daily chart, revealing a bearish trend. The market displays impulsive behavior, suggesting strong and sustained downward price movements.
Key Wave Structure
- Primary Wave Structure: Navy Blue Wave 3 follows the completion of navy blue wave 2, marking the onset of a significant bearish trend.
- Current Position: Gray Wave 1 within navy blue wave 3 represents the initial phase of the downward movement, forecasting further declines.
Next Anticipated Market Shift
The market is expected to transition into navy blue wave 4, a corrective phase following the completion of wave 3.
Invalidation Level
Level: 1.30559: If the price reaches this level, the current Elliott Wave count and bearish outlook will be invalidated. This key benchmark aids traders in reassessing their positions and managing risk effectively.
Conclusion
The Elliott Wave analysis confirms that GBPUSD remains in a bearish phase within navy blue wave 3.
- The phase is marked by strong downward momentum.
- The completion of navy blue wave 2 aligns with the ongoing bearish sentiment.
- The invalidation level at 1.30559 is critical for monitoring trend validity.
- Traders should remain attentive to the continuation of the downtrend while preparing for corrective moves as wave 3 concludes and transitions into navy blue wave 4.
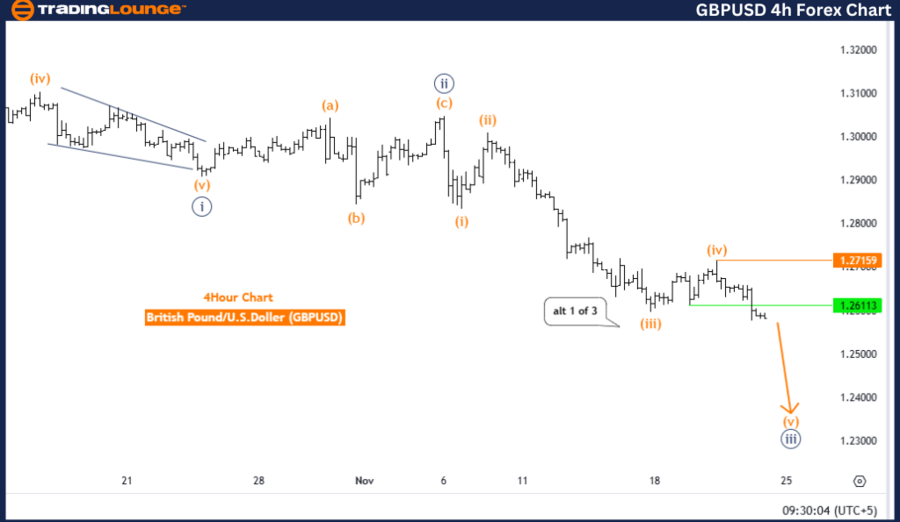
TradingLounge British Pound/U.S. Dollar (GBPUSD) 4-Hour Chart
GBPUSD Elliott Wave Technical Analysis
Function: Bearish Trend
Mode: Impulsive
Structure: Orange Wave 5
Position: Navy Blue Wave 3
Direction (Next Higher Degrees): Navy Blue Wave 4
Details
Orange wave 4 appears complete, with orange wave 5 of navy blue wave 3 now unfolding.
Wave Cancel Invalidation Level: 1.27159
Currency Market Analysis Overview
The 4-hour Elliott Wave analysis identifies a bearish trend in the GBPUSD pair, supported by an impulsive market mode.
Key Wave Structure
- Current Focus: Orange Wave 5 follows the conclusion of orange wave 4 as part of the larger navy blue wave 3.
- Trend Direction: The analysis indicates the final stages of wave 3, where orange wave 5 is expected to push prices lower before a major corrective phase emerges.
Next Market Movements
The bearish trend is anticipated to persist with the progression of orange wave 5, culminating navy blue wave 3. After this phase, the market is likely to transition into navy blue wave 4, signaling a corrective phase.
Invalidation Level
Conclusion
The 4-hour chart reinforces the bearish outlook, highlighting the development of orange wave 5 within navy blue wave 3.
- The trend suggests continued downward movement, consistent with the impulsive mode.
- Traders must monitor price activity around the invalidation level of 1.27159 to adjust their strategies.
- A corrective phase is anticipated upon the conclusion of navy blue wave 3.
This analysis emphasizes the importance of wave structure monitoring for effective trading strategies and risk management.
Technical Analyst: Malik Awais
Source: visit Tradinglounge.com and learn From the Experts Join TradingLounge Here
Previous: EURUSD Elliott Wave Technical Analysis
VALUE Offer - Buy 1 Month & Get 3 Months!Click here
Access 7 Analysts Over 200 Markets Covered. Chat Room With Support