12May

Theta Token (THETAUSD) Elliott Wave Analysis: Predicting Price Movements and Trading Strategies Using Technical Indicators

Theta Token / U.S. Dollar (THETAUSD) Elliott Wave Analysis – TradingLounge Daily Chart

THETAUSD Elliott Wave Technical Analysis

Function: Trend-following

Mode: Motive

Structure: Impulse

Wave Position: Wave 3

Next Higher Degree Direction: Not specified

Wave Cancel Invalid Level: Not defined

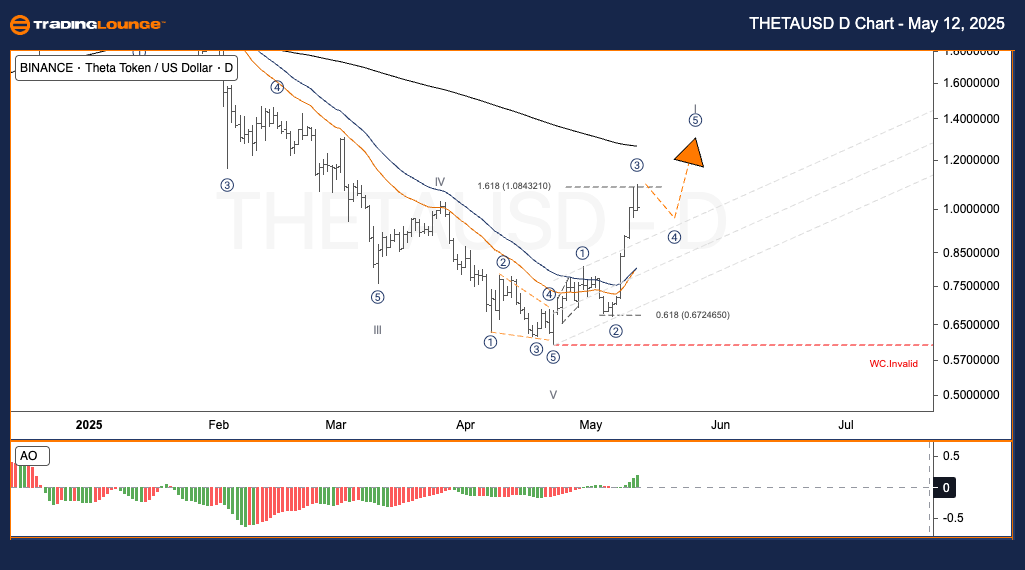
Theta Token (THETAUSD) Daily Elliott Wave Trading Strategy
As of early April, THETAUSD established key support around $0.67, aligning with the Fibonacci 61.8% retracement. The market then surged higher in wave (3). Recently, THETAUSD broke above the 1.618 Fibonacci extension of wave (1) at $1.084, implying wave (3) is approaching its peak. A corrective move in wave (4) could follow, potentially paving the way for wave (5) to drive the price further. Medium-term projections point above $1.20.

Trading Strategies

  • Approach:

Short-term swing traders:
Monitor for the wave (4) correction to finalize, then prepare for a long position in wave (5).

  • Risk Management:

🟥 Critical Alert:
A price drop beneath the red support zone (wave count invalid level) would invalidate the current wave structure.

THETAUSD-Day-Crypto-...


Theta Token / U.S. Dollar (THETAUSD) Elliott Wave Analysis – TradingLounge H4 Chart

THETAUSD Elliott Wave Technical Analysis

Function: Trend-following

Mode: Motive

Structure: Impulse

Wave Position: Wave 3

Next Higher Degree Direction: Not specified

Wave Cancel Invalid Level: Not defined

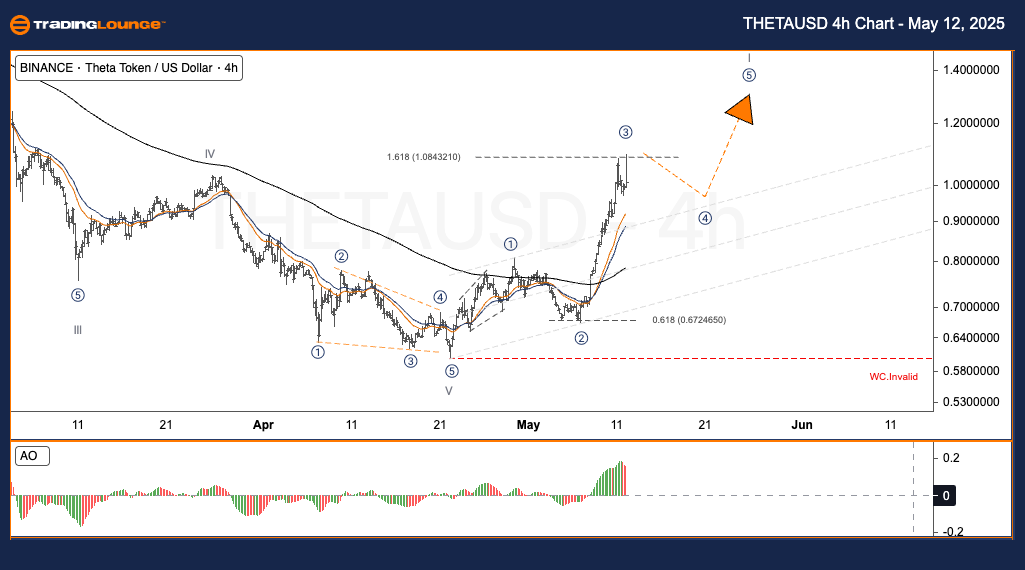
Theta Token (THETAUSD) 4-Hour Elliott Wave Trading Strategy
Mirroring the daily timeframe, THETAUSD on the H4 chart continues its strong uptrend from the $0.67 support base. After breaking above the 1.618 Fibonacci extension at $1.084, it indicates that wave (3) is near its endpoint. A temporary pullback in wave (4) may offer a new buying opportunity as the asset gears up for wave (5). Targets remain above $1.20 in the short to mid-term.

Trading Strategies

  • Approach:

Short-term swing traders:
Watch closely for wave (4) to complete. This phase could offer a strategic entry for wave (5).

  • Risk Management:

🟥 Warning:
A break below the red invalidation level will negate the wave count and require a reevaluation.

Technical Analyst: Kittiampon Somboonsod, CEWA

Source: Visit Tradinglounge.com and learn from the Experts. Join TradingLounge Here 

Previous: DOTUSD Elliott Wave Technical Analysis

VALUE Offer - Buy 1 Month & Get 3 Months!Click here

Access 7 Analysts Over 200 Markets Covered. Chat Room With Support

THETAUSD-4h-Crypto-C...

Related

ChainLink / U.S. dollar(LINKUSD) Elliott Wave Technical Analysis 2 November 23

ChainLink / U.S. dollar(LINKUSD) Elliott Wave Technical Analysis 2 November 23

Chainlink/U.S. dollar (LINKUSD) Elliott Wave Technical Analysis for 2 November 23, Elliott Wave Anal...

Read More >
Get Specific Price Targets: Westpac Banking Corporation Stock Analysis & Elliott Wave Technical Forecast

Get Specific Price Targets: Westpac Banking Corporation Stock Analysis & Elliott Wave Technical Forecast

Our comprehensive Elliott Wave analysis for WESTPAC BANKING CORPORATION (WBC) on the Australian Stoc...

Read More >
Risk Management Strategies for Australian Dollar/U.S. Dollar: AUD/USD Forex Elliott Wave Technical Analysis

Risk Management Strategies for Australian Dollar/U.S. Dollar: AUD/USD Forex Elliott Wave Technical Analysis

Discover the latest AUD/USD Elliott Wave analysis focusing on day and 4-hour chart insights. Learn a...

Read More >
CAC 40 Elliott Wave Forecast with Daily and Weekly Chart Analysis Highlighting Corrective Wave Structure and France Stock Market

CAC 40 Elliott Wave Forecast with Daily and Weekly Chart Analysis Highlighting Corrective Wave Structure and France Stock Market

Accurate Elliott Wave forecast for the CAC 40 index with detailed daily and weekly chart analysis. U...

Read More >
Natural Gas Elliott Wave Technical Analysis: NG Experiencing a Bearish Trend Persists

Natural Gas Elliott Wave Technical Analysis: NG Experiencing a Bearish Trend Persists

Natural Gas (NG) is currently experiencing a bearish trend, with Elliott Wave analysis indicating fu...

Read More >
Mastering Market Movements: Navigating Dips with Elliott Wave Analysis for Optimized Trading Strategies

Mastering Market Movements: Navigating Dips with Elliott Wave Analysis for Optimized Trading Strategies

This video provides an insightful update on Elliott Wave Analysis, focusing on the impact of a posit...

Read More >

$1 for 2 Weeks

then $29 a month!

What a Special Offer!

Trade Recommendations

Unleash the power of deversified trading with our comprehensive portfolio, covering 250+ markets:

  • Stock Trades
  • Crypto Trades
  • Forex Trades
  • Commodity Trades
Elliott Wave Analysis

Gain a competitive edge with expert insights and AI-powered Elliott Wave charting into:

  • Global Indices
  • US Stocks & ASX Stocks
  • Forex & Crypto
  • Commodities
Top-Notch Trading Tools

Equip yourself with the tools of success:

  • Real-time Chat rooms
  • Elliott Wave Algorithm
  • Portfolio tools
  • TradingLevels
  • Screener
  • Trading Game
7 Elliott Wave Analysts

Stay ahead of the market with daily charts and insightful videos
Your secret to strategic trading!

JOIN HERE


Welcome to TradingLounge (ASIC A.R.No. 321187), specialists in trades, trading education and technical analysis, covering stocks, indices, commodities, forex and cryptocurrencies.

When you join TradingLounge you have access to everything we offer, including trade tools, educational content and a social platform to chat with like-minded investors.

Read more

@Copyright 2024 by tradinglounge.com

Contact Us

Australian no: 02 4787 6020

International no: +61 (2) 47876020

Pay with:

Find us on