Silver Elliott Wave Technical Analysis

Silver surpassed the August 26, 2024 high, continuing its recovery that began on August 6. The commodity is likely to challenge the May 20 high, setting up a fresh yearly high. 2024 has been a dynamic year, with Silver rising from around $24, achieving nearly a 40% gain since January. The strategy of buying dips remains the most effective approach for traders.

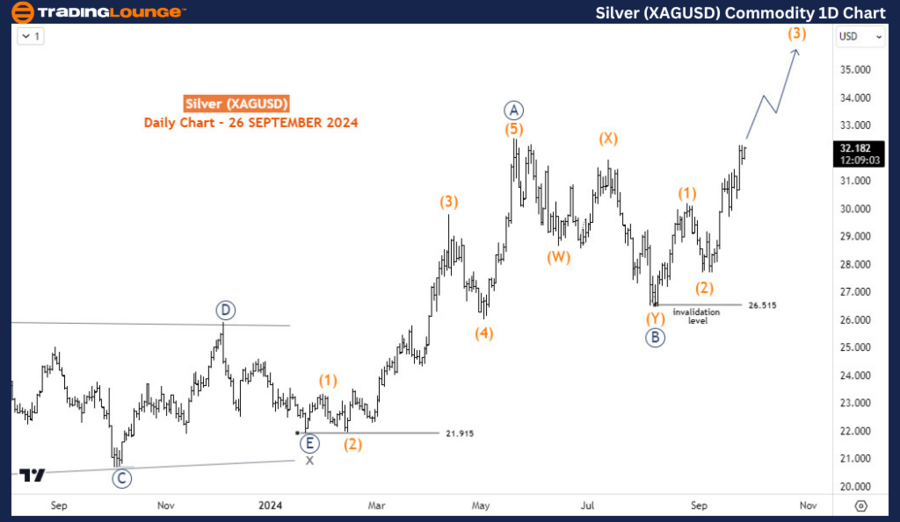
Silver (XAGUSD) Commodity Daily Chart Analysis

Silver initiated an impulse wave sequence on January 22, or at least a long-term 2-swing bounce. Wave A or 1 (circled) was completed at $32.5 on May 20, 2024, after the completion of an impulse wave structure. Following that, a pullback in a double zigzag structure completed wave B or 2 (circled) at $26.5 on August 6, 2024. From the $26.5 level, wave C or 3 (circled) began, which is expected to evolve into a 5-wave structure. Waves (1) and (2) were completed in late August and early September, respectively. Currently, the price is in wave (3), which is projected to extend to around $34 (a new 2024 high) or higher, before the next pullback in wave (4). The long-term target range is $37 to $42. Given this potential, traders should consider buying during the pullbacks.

Silver-XAGUSD-Commod...


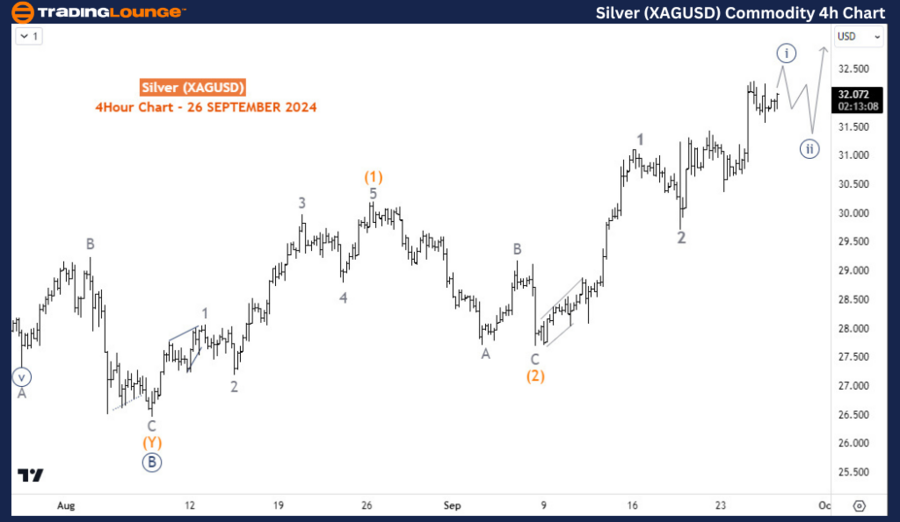
Silver (XAGUSD) Commodity 4-Hour Chart Analysis

The H4 chart reveals the sub-waves of wave (3). Waves 1 and 2 of (3) have been completed, and the price is now advancing in wave 3. At a lower degree, the commodity appears to be in an impulse structure for wave i (circled) of 3, which is likely to experience a pullback in wave ii (circled) before continuing its upward trend. Traders should look for fresh buying opportunities during waves ii & iv (circled) of 3 and also during the wave 4 pullback in both the short and medium term.

Technical Analyst: Sanmi Adeagbo

Source: visit Tradinglounge.com and learn From the Experts Join TradingLounge Here 

See Previous: Copper Elliott Wave Technical Analysis

VALUE Offer - Buy 1 Month & Get 3 Months!Click here

Access 7 Analysts Over 200 Markets Covered. Chat Room With Support

Silver-XAGUSD-Commod...

Related

Visa Inc. (V) Elliott Wave Analysis: Forecast $380 Resistance, Wave {iv} Correction Incoming Before Final Push in Wave (v)

Visa Inc. (V) Elliott Wave Analysis: Forecast $380 Resistance, Wave {iv} Correction Incoming Before Final Push in Wave (v)

Visa Inc. (V) shows a strong Elliott Wave uptrend toward $380, with an anticipated wave {iv} correct...

Read More >
Natural Gas Elliott Wave Analysis: Technical Forecast, Market Outlook, and Trading Strategy for Bearish Trend Continuation

Natural Gas Elliott Wave Analysis: Technical Forecast, Market Outlook, and Trading Strategy for Bearish Trend Continuation

This Natural Gas Elliott Wave forecast provides a detailed technical analysis of price trends, highl...

Read More >
In-Depth Analysis breaks down the Uniswap Crypto UNIUSD Elliott Wave Technical Analysis and Price Movements

In-Depth Analysis breaks down the Uniswap Crypto UNIUSD Elliott Wave Technical Analysis and Price Movements

This article provides an in-depth Elliott Wave Uniswap (UNIUSD) analysis, focusing on the latest pri...

Read More >
S&P BSE Sensex (India) Index Elliott Wave Technical Analysis: Comprehensive insights into daily and weekly market trends

S&P BSE Sensex (India) Index Elliott Wave Technical Analysis: Comprehensive insights into daily and weekly market trends

The S&P BSE Sensex Elliott Wave Analysis offers comprehensive insights into daily and weekly market ...

Read More >
Valuable Forex Trading Strategies For U.S. Dollar / Swiss Franc Currency Pair with USDCHF Elliott Wave Technical Analysis

Valuable Forex Trading Strategies For U.S. Dollar / Swiss Franc Currency Pair with USDCHF Elliott Wave Technical Analysis

This article provides a thorough USDCHF analysis based on Elliott Wave theory, covering daily and 4-...

Read More >
JP Morgan Chase & Co.(JPM:NYSE) Elliott Wave Technical Analysis 27 October 23

JP Morgan Chase & Co.(JPM:NYSE) Elliott Wave Technical Analysis 27 October 23

JP Morgan Chase & Co., Stock Market Analysis - Trading Lounge Elliott Wave Technical Analysis Chart ...

Read More >

$1 for 2 Weeks

then $29 a month!

What a Special Offer!

Trade Recommendations

Unleash the power of deversified trading with our comprehensive portfolio, covering 250+ markets:

  • Stock Trades
  • Crypto Trades
  • Forex Trades
  • Commodity Trades
Elliott Wave Analysis

Gain a competitive edge with expert insights and AI-powered Elliott Wave charting into:

  • Global Indices
  • US Stocks & ASX Stocks
  • Forex & Crypto
  • Commodities
Top-Notch Trading Tools

Equip yourself with the tools of success:

  • Real-time Chat rooms
  • Elliott Wave Algorithm
  • Portfolio tools
  • TradingLevels
  • Screener
  • Trading Game
7 Elliott Wave Analysts

Stay ahead of the market with daily charts and insightful videos
Your secret to strategic trading!

JOIN HERE


Welcome to TradingLounge (ASIC A.R.No. 321187), specialists in trades, trading education and technical analysis, covering stocks, indices, commodities, forex and cryptocurrencies.

When you join TradingLounge you have access to everything we offer, including trade tools, educational content and a social platform to chat with like-minded investors.

Read more

@Copyright 2024 by tradinglounge.com

Contact Us

Australian no: 02 4787 6020

International no: +61 (2) 47876020

Pay with:

Find us on