Copper Commodity Elliott Wave Technical Analysis

Copper has seen a significant rise since its August 7th low, posting gains of over 14%. The commodity is positioned for more upward movement, with the possibility of reaching the 4.7 resistance level before a potential pullback.

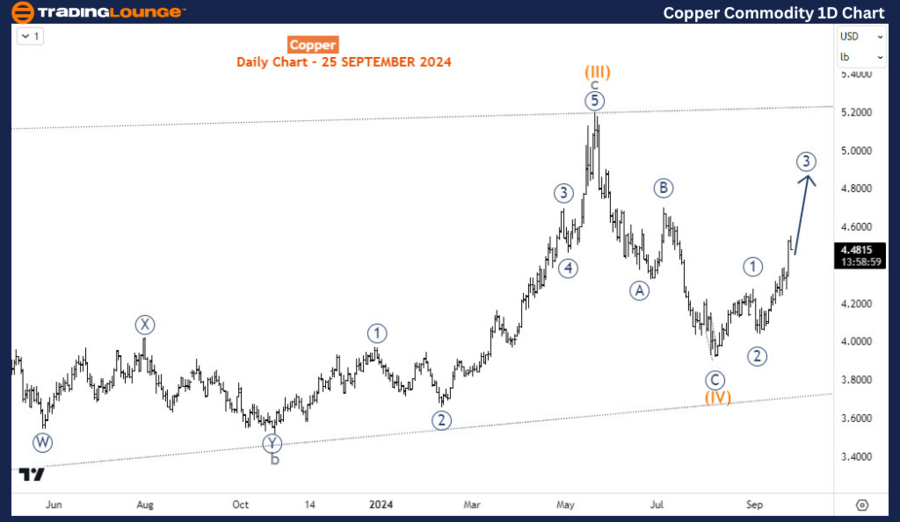
Copper Commodity Long-Term Bullish Trend in Copper

Copper has been in a long-term uptrend since March 2020. During this time, a diagonal pattern appears to be forming, with waves (I), (II), and (III) of the supercycle degree completing in March 2022, July 2022, and May 2024, respectively. Afterward, wave (IV) began in May 2024 and found support in August 2024. Two scenarios could play out for wave (IV). Either it has concluded as a zigzag formation, or it may extend into a double zigzag if the current rally fails to exceed the May 2024 high.

If the ongoing bounce from August 2024 develops as an impulsive wave, this would signal the completion of wave (IV) and the start of wave (V). On the other hand, if this bounce forms as a corrective pattern, wave (IV) could extend further downward. The critical level to monitor is 4.62. A break above this level would confirm the continuation of the bullish wave (V). If the rally falls short of breaking 4.62, the probability of further downside increases, favoring an extended wave (IV). However, the overall trend remains bullish until a clear reversal signals otherwise.

Copper-Commodity-1D-...


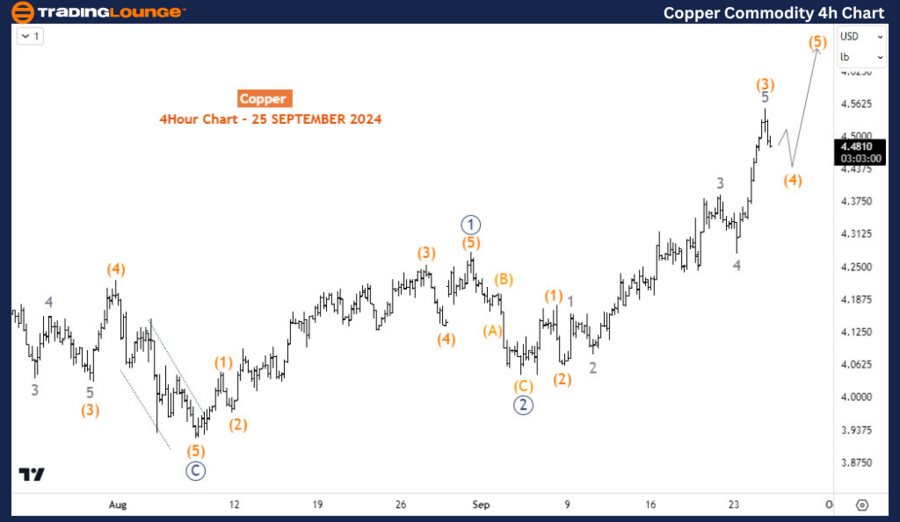
Copper Commodity Key Levels on the H4 Chart

On the H4 timeframe, Copper is experiencing a dip in wave (4) of the primary degree wave 3 (circled). This pullback is expected to find support between the 4.43 and 4.36 levels. Once support is confirmed, wave (5) should drive Copper higher, targeting the 4.62 to 4.7 range.

Technical Analyst: Sanmi Adeagbo

Source: visit Tradinglounge.com and learn From the Experts Join TradingLounge Here 

See Previous: WTI Crudeoil Elliott Wave Technical Analysis

VALUE Offer - Buy 1 Month & Get 3 Months!Click here

Access 7 Analysts Over 200 Markets Covered. Chat Room With Support

Copper-Commodity-4h-...


Conclusion

Copper continues to maintain its long-term bullish trend, with the current rally determining whether wave (IV) has concluded or if another downward leg is necessary. Traders should closely watch for a break above 4.62, as this would confirm the next major upside movement.

Related

HCL TECHNOLOGIES Indian Stocks Elliott Wave Technical Analysis and Stock Forecast: Learn About Price Predictions and Invalidation Points

HCL TECHNOLOGIES Indian Stocks Elliott Wave Technical Analysis and Stock Forecast: Learn About Price Predictions and Invalidation Points

Get a comprehensive analysis of HCL Technologies (HCLTECH) using Elliott Wave theory. Learn about pr...

Read More >
Australian Dollar / Japanese Yen(AUDJPY) Elliott Wave Technical Analysis 14 November 23

Australian Dollar / Japanese Yen(AUDJPY) Elliott Wave Technical Analysis 14 November 23

Australian Dollar / Japanese Yen(AUDJPY) Elliott Wave Technical Analysis 14 November 23, In summary,...

Read More >
S&P 500 ELLIOTT WAVE ANALYSIS, 4 NOV. 2021

S&P 500 ELLIOTT WAVE ANALYSIS, 4 NOV. 2021

SP500 NASDAQ 100 Russell 2000 Technical Analysis Elliott Wave Forecast & Trading. S&P 500: Bullish t...

Read More >
Offering Insights into Binance Crypto Price News Today Binance / U.S. Dollar (BNBUSD) Elliott Wave Technical Analysis

Offering Insights into Binance Crypto Price News Today Binance / U.S. Dollar (BNBUSD) Elliott Wave Technical Analysis

This article provides a detailed BNBUSD Elliott Wave analysis, offering insights into Binance Coin&#...

Read More >
AMCOR Stock Forecast: ASX AMC Starts Bullish Wave 3 After Corrective Zigzag – Elliott Wave Analysis, Price Targets, Trade Setups

AMCOR Stock Forecast: ASX AMC Starts Bullish Wave 3 After Corrective Zigzag – Elliott Wave Analysis, Price Targets, Trade Setups

AMCOR (ASX: AMC) completes a corrective wave and begins bullish Wave (3). Discover price targets, in...

Read More >
NEO Elliott Wave Forecast Reveals Bullish Trade Setup With Wave III Breakout Signal on Daily and H4 Technical Analysis Charts

NEO Elliott Wave Forecast Reveals Bullish Trade Setup With Wave III Breakout Signal on Daily and H4 Technical Analysis Charts

Discover a potential bullish reversal in NEO using Elliott Wave analysis. Daily and H4 charts signal...

Read More >

$1 for 2 Weeks

then $29 a month!

What a Special Offer!

Trade Recommendations

Unleash the power of deversified trading with our comprehensive portfolio, covering 250+ markets:

  • Stock Trades
  • Crypto Trades
  • Forex Trades
  • Commodity Trades
Elliott Wave Analysis

Gain a competitive edge with expert insights and AI-powered Elliott Wave charting into:

  • Global Indices
  • US Stocks & ASX Stocks
  • Forex & Crypto
  • Commodities
Top-Notch Trading Tools

Equip yourself with the tools of success:

  • Real-time Chat rooms
  • Elliott Wave Algorithm
  • Portfolio tools
  • TradingLevels
  • Screener
  • Trading Game
7 Elliott Wave Analysts

Stay ahead of the market with daily charts and insightful videos
Your secret to strategic trading!

JOIN HERE


Welcome to TradingLounge (ASIC A.R.No. 321187), specialists in trades, trading education and technical analysis, covering stocks, indices, commodities, forex and cryptocurrencies.

When you join TradingLounge you have access to everything we offer, including trade tools, educational content and a social platform to chat with like-minded investors.

Read more

@Copyright 2024 by tradinglounge.com

Contact Us

Australian no: 02 4787 6020

International no: +61 (2) 47876020

Pay with:

Find us on