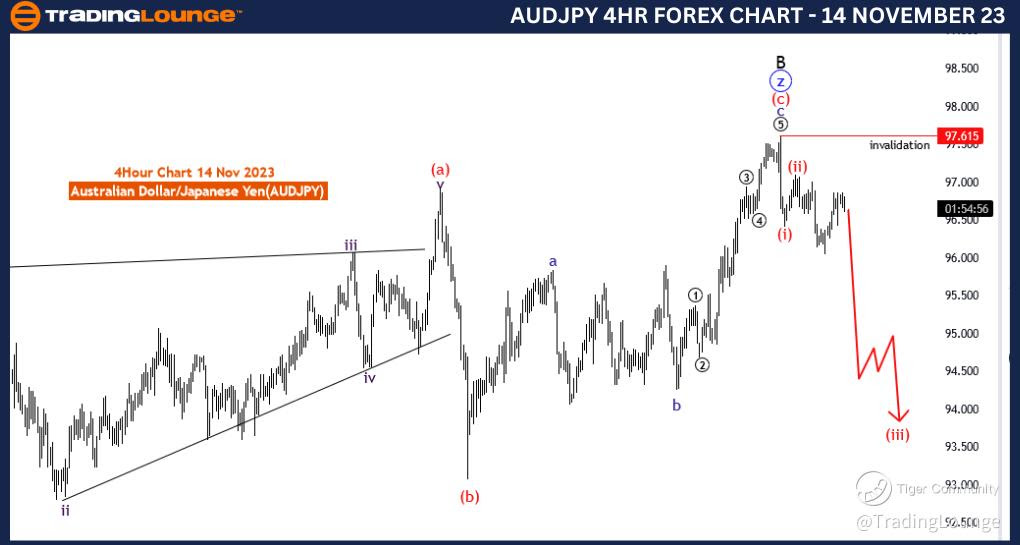
AUDJPY Elliott Wave Analysis Trading Lounge 4 Hour Chart,14 November 23
Australian Dollar / Japanese Yen(AUDJPY) 4 Hour Chart
AUDJPY Elliott Wave Technical Analysis
Function: Counter Trend
Mode: impulsive
Structure: red wave 3 of 1
Position: Black wave C
Direction Next lower Degrees: red wave 3 of 1 (continue)
Details: red wave 2 looking completed at 97.116 . Now red wave 3 of 1 is in play. Wave Cancel invalid level: 97.615
The "AUDJPY Elliott Wave Analysis Trading Lounge 4 Hour Chart" dated 14 November 23, offers a detailed examination of the Australian Dollar/Japanese Yen (AUDJPY) currency pair using Elliott Wave theory. This analysis is specific to the 4-hour chart, providing insights for traders looking at shorter-term perspectives.
The identified "Function" is labeled as "Counter Trend," indicating that the current market sentiment is against the prevailing trend. In Elliott Wave terms, this suggests that the price movement being analyzed is part of a correction rather than the larger trend.
The "Mode" is described as "Impulsive," suggesting that the current corrective phase is characterized by strong, trending movements. Impulsive waves, even within a counter-trend context, can have significant price swings.
The "Structure" is identified as "Red wave 3 of 1." This signifies that the market is potentially in the third impulsive wave of a smaller degree within the broader corrective structure.
The "Position" is recognized as "Black wave C," indicating that the current impulsive move is part of a larger corrective wave labeled as C.
Concerning the "Direction Next Lower Degrees," the analysis suggests that "red wave 3 of 1 (may continue)." This implies that the ongoing impulsive move could persist further, providing potential trading opportunities within the broader counter-trend context.
In terms of "Details," the report notes the completion of "Red wave 2" at 97.116. This completion signifies the end of the second wave within the current corrective structure, and now the market is in the early stages of the third impulsive wave (red wave 3).
The "Wave Cancel invalid level" is set at 97.615. This level serves as a crucial reference point for traders. If the price surpasses this level, it might indicate a deviation from the current wave count and could prompt a reassessment of the market structure.
In summary, the AUDJPY Elliott Wave Analysis on the 4-hour chart suggests an impulsive counter-trend move. The focus is on the development of the third impulsive wave (red wave 3) within the larger corrective structure. Traders are advised to monitor the invalidation level for potential adjustments in their trading strategies.
Technical Analyst: Malik Awais
Source: Tradinglounge.com get trial here!
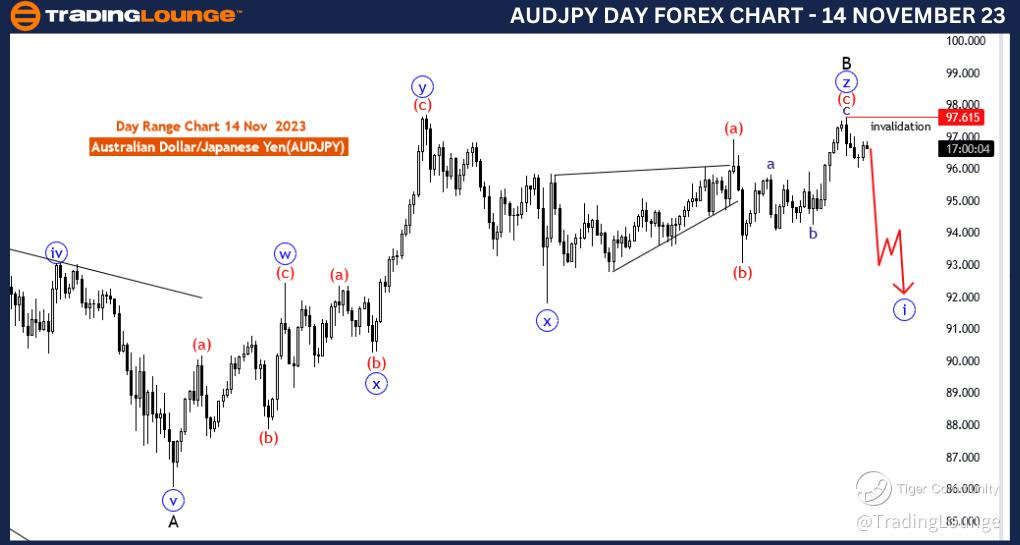
AUDJPY Elliott Wave Analysis Trading Lounge Day Chart,14 November 23
Australian Dollar / Japanese Yen(AUDJPY) Day Chart
AUDJPY Elliott Wave Technical Analysis
Function: Counter Trend
Mode: impulsive
Structure: blue wave 1 of black wave C
Position: Black wave C
Direction Next lower Degrees: blue wave 1 (started)
Details: black wave B completed at 97.615 , Now blue wave 1 of black wave C started. Wave Cancel invalid level: 97.615
The "AUDJPY Elliott Wave Analysis Trading Lounge Day Chart" dated 14 November 23, provides a comprehensive overview of the Australian Dollar/Japanese Yen (AUDJPY) currency pair within the framework of Elliott Wave theory. This analysis is focused on the daily chart, offering a broader perspective for traders with longer-term horizons.
The identified "Function" is labeled as "Counter Trend," indicating that the current analysis is within the context of a corrective phase rather than a continuation of the prevailing trend. This suggests that the market is undergoing a temporary reversal against the larger trend.
The "Mode" is described as "Impulsive," which implies that the current counter-trend move is characterized by strong, trending movements. Despite being counter-trend, impulsive waves can exhibit significant price action.
The "Structure" is identified as "Blue wave 1 of Black wave C." This signifies that the current impulsive move is the initial wave within a larger corrective structure labeled as C.
The "Position" is recognized as "Black wave C," indicating that the ongoing impulsive move is part of a broader corrective wave labeled as C.
Concerning the "Direction Next Lower Degrees," the analysis suggests that "blue wave 1 (may have started)." This implies that the initial impulsive wave within the larger corrective structure is in progress.
In terms of "Details," the report notes that "Black wave B" completed at 97.615. This completion indicates the end of the preceding corrective wave, and now the market has transitioned into the impulsive phase with the initiation of "Blue wave 1 of Black wave C."
The "Wave Cancel invalid level" is set at 97.615, highlighting the significance of this level in validating the current wave count. A breach of this level could suggest a deviation from the expected wave structure.
In summary, the AUDJPY Elliott Wave Analysis on the daily chart suggests an impulsive counter-trend move. The focus is on the development of the initial impulsive wave (Blue wave 1) within the larger corrective structure (Black wave C). Traders are advised to monitor the invalidation level for potential adjustments in their trading strategies.