14Feb

JAMES HARDIE INDUSTRIES PLC Elliott Wave Analysis: ASX:JHX Stock Forecast, Support & Resistance Levels, and Market Trends

JAMES HARDIE INDUSTRIES PLC (JHX) Elliott Wave Technical Analysis

Market Overview

Greetings,

This Elliott Wave analysis delivers an updated outlook on JAMES HARDIE INDUSTRIES PLC (JHX), a key stock on the Australian Stock Exchange (ASX). Based on current price action, ASX:JHX shares are expected to experience a downtrend in the medium term. The long strategy requires careful planning, as market risks remain a significant factor. This technical analysis evaluates potential trend direction and key price levels, offering both quantitative and intuitive insights into upcoming market movements.


JAMES HARDIE INDUSTRIES PLC (JHX) Elliott Wave Technical Analysis

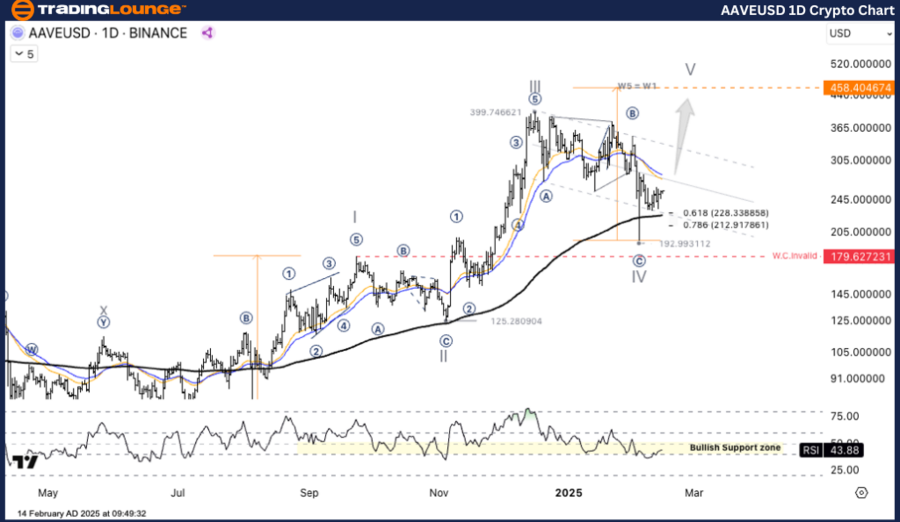
1D Chart (Semilog Scale) Analysis

Function: Major Trend (Intermediate Degree - Orange)

Mode: Motive

Structure: Impulse

Position: Wave C (Grey) of Wave (2) (Orange)

Analysis Details:

The Wave (2) (Orange) continues to develop and aligns with a Zigzag pattern. Recently, the market showed extended sideways movement, forming a Triangle pattern, identified as Wave B (Grey), which has now completed. The price action suggests an entry into Wave C (Grey), implying a bearish movement ahead.

If the price drops below 49.16, this would confirm the bearish Elliott Wave scenario.

  • Invalidation Point: 55.09
  • Key Support Level: 49.16

AAVEUSD-1d-crypto-ch...


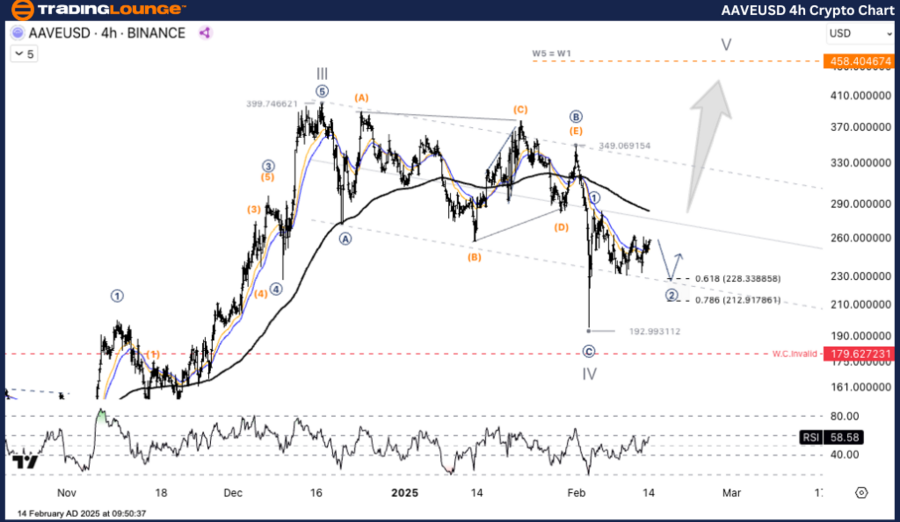
JAMES HARDIE INDUSTRIES PLC (JHX) Elliott Wave Technical Analysis (4-Hour Chart)

TradingLounge (4-Hour Chart Analysis)

Function: Major Trend (Intermediate Degree - Orange)

Mode: Motive

Structure: Impulse

Position: Wave C (Grey) of Wave (2) (Orange)

Analysis Details:

A detailed view of the 4-hour chart highlights the completion of Wave ((e)) (Navy) of Wave B (Grey) in a three-wave Zigzag pattern, reaching 55.09. Based on Elliott Wave principles, the market is expected to turn bearish in the short term. A break below 49.16 would reinforce the downtrend, providing further confidence in a bearish outlook.

  • Invalidation Point: 55.09
  • Key Support Level: 49.16

Technical Analyst: Hua (Shane) Cuong, CEWA-M (Master’s Designation).

Source: visit Tradinglounge.com and learn From the Experts Join TradingLounge Here 

See Previous: NEWMONT CORPORATION - NEM Elliott Wave Technical Analysis

VALUE Offer - Buy 1 Month & Get 3 Months!Click here

Access 7 Analysts Over 200 Markets Covered. Chat Room With Support

AAVEUSD-4h-crypto-ch...


Conclusion

This Elliott Wave forecast provides a structured approach to analyzing the JAMES HARDIE INDUSTRIES PLC (JHX) stock trend, helping traders strategize based on market movements. Our analysis emphasizes critical price levels, serving as confirmation or invalidation signals, reinforcing trading confidence.

By integrating Elliott Wave principles, we ensure an objective and professional outlook on the current market conditions, allowing traders to make informed buy or sell decisions.

Related

TSLA Stock Forecast: Tesla Elliott Wave Technical Analysis & Key Price Levels

TSLA Stock Forecast: Tesla Elliott Wave Technical Analysis & Key Price Levels

This comprehensive Elliott Wave analysis of Tesla Inc. (TSLA) provides an in-depth look at both dail...

Read More >
ASX CAR Group Limited Elliott Wave Analysis: Stock Forecast, Price Targets, Trading Strategies, and Key Market Insights for Success

ASX CAR Group Limited Elliott Wave Analysis: Stock Forecast, Price Targets, Trading Strategies, and Key Market Insights for Success

Explore comprehensive Elliott Wave analysis for ASX CAR Group Limited (CAR). Our detailed insights c...

Read More >
Unlock EUR/GBP's Market Potential with Expert Elliott Wave Analysis and Forecast for Stronger Forex Trading Strategies

Unlock EUR/GBP's Market Potential with Expert Elliott Wave Analysis and Forecast for Stronger Forex Trading Strategies

This article provides a thorough Elliott Wave analysis of the EUR/GBP pair, focusing on the latest t...

Read More >
Learn the key aspects of NAB Stock Analysis & Elliott Wave Technical Forecast: NATIONAL AUSTRALIA BANK LIMITED

Learn the key aspects of NAB Stock Analysis & Elliott Wave Technical Forecast: NATIONAL AUSTRALIA BANK LIMITED

Stay ahead with our comprehensive analysis of National Australia Bank (NAB) stocks using Elliott Wav...

Read More >
META's Stock Movements: Meta Platforms Inc. (META) Stocks Elliott Wave Technical Analysis

META's Stock Movements: Meta Platforms Inc. (META) Stocks Elliott Wave Technical Analysis

This article provides a detailed Elliott Wave analysis of Meta Platforms Inc. (META). It covers META...

Read More >

Buy 1 Month

Get 3 Months!

Special Offer:

Trade Recommendations

Unleash the power of deversified trading with our comprehensive portfolio, covering:

  • Stock Trades
  • Crypto Trades
  • Forex Trades
  • Commodity Trades
Elliott Wave Analysis

Gain a competive edge with expert insights in to:

  • Global Indices
  • US Stocks & ASX Stocks
  • Forex & Crypto
  • Commodities
Top-Notch Trading Tools

Equip yourself with the tools of success:

  • Social Chat
  • Elliott Wave Algorithm
  • Screener
  • TradingLevels
  • Trading Game
7 Elliott Wave Analysts

Stay ahead of the market with daily charts and insightful videos
-Your secret to strategic trading!

JOIN HERE


Welcome to TradingLounge (ASIC A.R.No. 321187), specialists in trades, trading education and technical analysis, covering stocks, indices, commodities, forex and cryptocurrencies.

When you join TradingLounge you have access to everything we offer, including trade tools, educational content and a social platform to chat with like-minded investors.

Read more

@Copyright 2024 by tradinglounge.com

Contact Us

Australian no: 02 4787 6020

International no: +61 (2) 47876020

Pay with:

Find us on