META Elliott Wave Analysis Trading Lounge Daily Chart

The Elliott Wave analysis for Meta Platforms Inc. (META) reveals a discrepancy between the daily and 4-hour chart interpretations as of May 10, 2024. Each chart provides a different perspective on the expected stock movements, catering to different trading strategies.

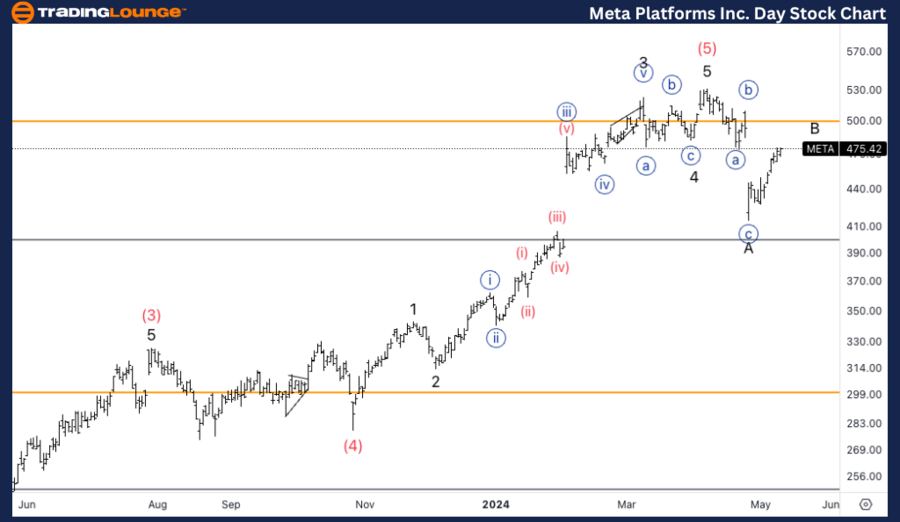
Meta Platforms Inc. (META) Daily Chart Analysis

META Elliott Wave Technical Analysis
 
FUNCTION: CounterTrend

MODE: Corrective

STRUCTURE: Flat

POSITION: Intermediate (A)

DIRECTION: Pullback in Minor B

DETAILS: We are showing two different counts in the Daily and 4H charts. Here we have a major top in place and we are looking for a larger correction to take place, looking for 500$ to provide resistance.

On the daily chart, META is categorized under a counter-trend with a corrective flat structure, currently in the Intermediate wave (A) phase. The focus is on a significant pullback in the Minor B wave, suggesting a broader market correction. The analysis indicates a major top already in place, with a downward trajectory expected to continue. A resistance level at $500 is anticipated, which might cap any potential upside and confirm the bearish outlook.
Meta-Platforms-Inc-1...


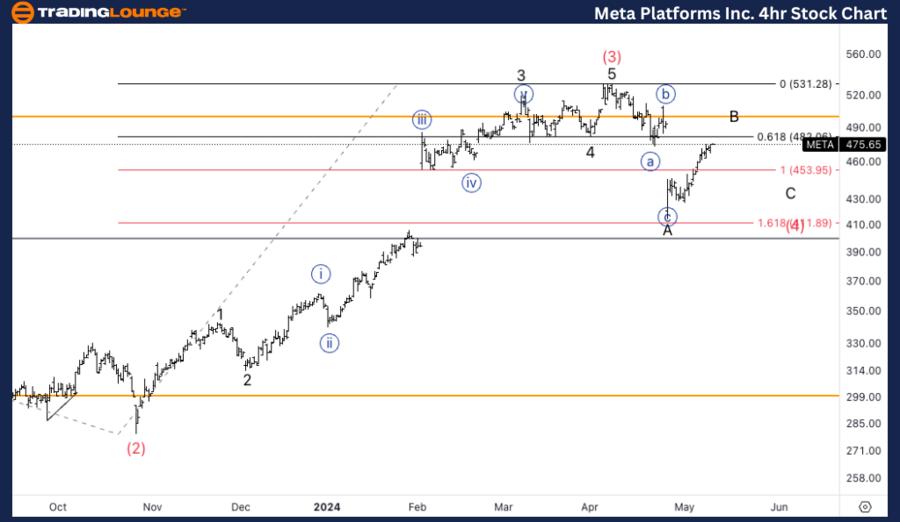
META Elliott Wave Analysis Trading Lounge 4Hr Chart,

Meta Platforms Inc., (META) 4Hr Chart Analysis

META Elliott Wave Technical Insights

FUNCTION: Counter Trend

MODE: Corrective

STRUCTURE: Flat

POSITION: Wave B or (4).

DIRECTION: Topping in wave B.  

DETAILS: Here we are looking at a smaller correction, we have measured wave (2) and equality of (4) and (2) stop at 450$. Looking for sideways consolidation in (4) or else we could already have a bottom in place.

The 4-hour chart presents a more micro view, still within a counter-trend but focusing on the smaller corrections within the overall structure. It is in the phase of Wave B or possibly in Wave (4), with a current top formation in Wave B. The equality between Wave (2) and Wave (4) is calculated to halt at $450, suggesting a shorter corrective phase than what is noted on the daily chart.

Technical Analyst: Malik Awais

Source: visit Tradinglounge.com and learn From the Experts Join TradingLounge Here 

See Previous: United Health Group Inc. (UNH) Elliott Wave Technical Overview

Special Trial Offer - 0.76 Cents a Day for 3 Months! Click here

Access 7 Analysts Over 170 Markets Covered. Chat Room With Support

Meta-Platforms-Inc-4...

Related

Market Update: Preparing for the Next Trade Setup

Market Update: Preparing for the Next Trade Setup

Most stocks are approaching the final stages of their Impulse, currently in Wave iv) within Wave 1. ...

Read More >
Uniswap/U.S. dollar(UNIUSD) Elliott Wave Technical Analysis 21 January 24

Uniswap/U.S. dollar(UNIUSD) Elliott Wave Technical Analysis 21 January 24

TradingLounge Uniswap and U.S. dollar(UNIUSD) Elliott Wave Technical Analysis dated 22 January 24

Read More >
Euro/U.S.Dollar(EURUSD) Forex Elliott Wave Technical Analysis: A Comprehensive Trading Guide

Euro/U.S.Dollar(EURUSD) Forex Elliott Wave Technical Analysis: A Comprehensive Trading Guide

This guide offers a detailed examination of EURUSD Elliott Wave analysis across both daily and 4-hou...

Read More >
Soybeans Commodity Elliott Wave Analysis: In-Depth Price Forecast, Technical Insights, and Key Trading Strategies

Soybeans Commodity Elliott Wave Analysis: In-Depth Price Forecast, Technical Insights, and Key Trading Strategies

Dive into the latest Soybeans Elliott Wave Analysis, featuring price forecasts, detailed chart analy...

Read More >
Bitcoin Elliott WaveTechnical Analysis:Bitcoin Price Prediction and Uptrend Trading Insights

Bitcoin Elliott WaveTechnical Analysis:Bitcoin Price Prediction and Uptrend Trading Insights

Explore detailed Bitcoin Elliott Wave analysis and BTCUSD price predictions. Learn about Wave V, bul...

Read More >
Corn Elliott Wave Analysis and Price Forecast: Bearish Trend, Technical Chart Patterns, and Long-Term Market Outlook Explained

Corn Elliott Wave Analysis and Price Forecast: Bearish Trend, Technical Chart Patterns, and Long-Term Market Outlook Explained

Corn Elliott Wave Analysis discusses the ongoing bearish trend from April 2022, the corrective bounc...

Read More >

$1 for 2 Weeks

then $29 a month!

What a Special Offer!

Trade Recommendations

Unleash the power of deversified trading with our comprehensive portfolio, covering 250+ markets:

  • Stock Trades
  • Crypto Trades
  • Forex Trades
  • Commodity Trades
Elliott Wave Analysis

Gain a competitive edge with expert insights and AI-powered Elliott Wave charting into:

  • Global Indices
  • US Stocks & ASX Stocks
  • Forex & Crypto
  • Commodities
Top-Notch Trading Tools

Equip yourself with the tools of success:

  • Real-time Chat rooms
  • Elliott Wave Algorithm
  • Portfolio tools
  • TradingLevels
  • Screener
  • Trading Game
7 Elliott Wave Analysts

Stay ahead of the market with daily charts and insightful videos
Your secret to strategic trading!

JOIN HERE


Welcome to TradingLounge (ASIC A.R.No. 321187), specialists in trades, trading education and technical analysis, covering stocks, indices, commodities, forex and cryptocurrencies.

When you join TradingLounge you have access to everything we offer, including trade tools, educational content and a social platform to chat with like-minded investors.

Read more

@Copyright 2024 by tradinglounge.com

Contact Us

Australian no: 02 4787 6020

International no: +61 (2) 47876020

Pay with:

Find us on