United Health Group Inc. (UNH) Elliott Wave Daily Technical Overview
The Elliott Wave analysis for UnitedHealth Group Inc. (UNH) provides a technical forecast for its stock behaviour on the Daily and 4-hour charts. This detailed analysis aims to guide traders and investors through the expected price movements influenced by UNH’s wave patterns.
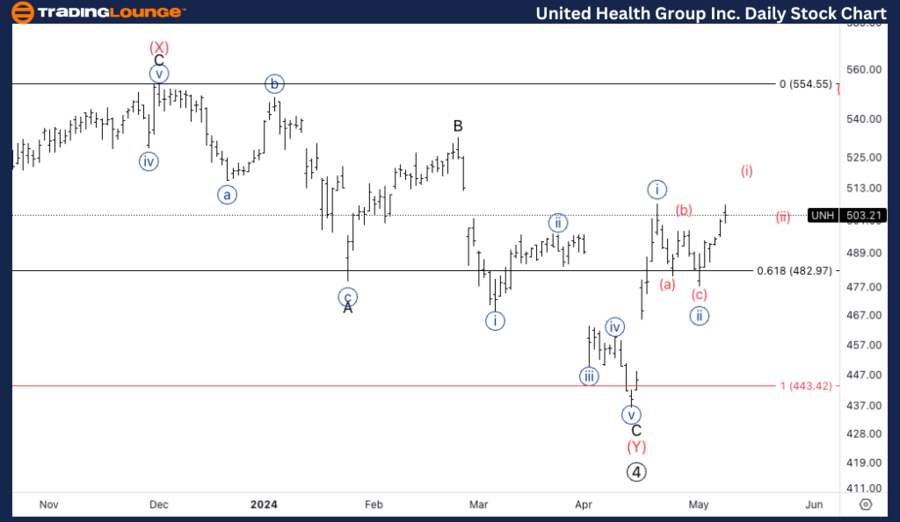
United Health Group Inc., (UNH) Daily Chart
UNH Elliott Wave Technical Analysis
FUNCTION: Trend
MODE: Impulsive
STRUCTURE: Motive
POSITION: Minute wave {iii}.
DIRECTION: Upside in Minute {ii}.
Analysis Details: The UNH stock appears to have established solid support at the $500 mark, aligning with trendline TL5. Forecasts suggest a potential upward movement, aiming for long-term targets around trendline TL8. This projection is based on the current momentum and past price behaviors, indicating a robust bullish trend continuation in the forthcoming sessions.
On the daily chart, UNH is currently in a Minute wave {iii} of its impulsive, motive wave structure, signaling robust upward potential. The stock found support at the $500 mark, along the critical TL5 (Trend Line 5). This support suggests a bullish resumption might be forthcoming, with the potential to reach higher trend line levels like TL8 over the long term.
Bitcoin Prediction Guess the Price? - Win 1 Million Satoshi Test Your Analysis
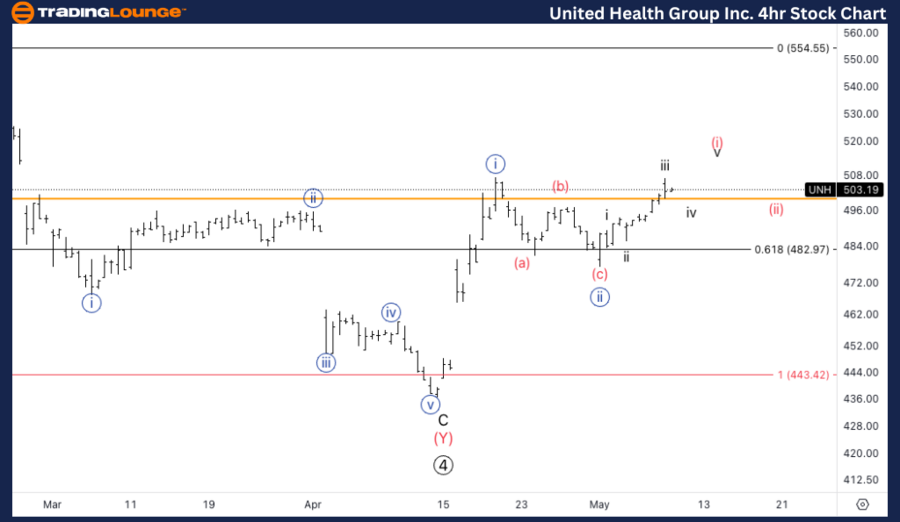
UNH Elliott Wave Analysis on the 4-Hour Trading Chart
UNH Technical Analysis Breakdown
Function: Trend Identification
Mode: Impulsive Trading Patterns
Structure: Motive Sequence
Position in Wave: Initial stage of wave (i) of {iii}
Wave Progression: Progressing through wave iii of initial wave (i)
Detailed Insights: The current focus is on the completion of the initial wave (i). Following this, a slight pullback in wave (ii) is expected, which would set an optimal stage for entering additional long positions. This strategy leverages the impulsive nature of Elliott waves, aiming to maximize gains from predicted upward trajectories.
Key Insights and Trading Strategy
Elliott Wave Analysis offers a structured approach to understanding market dynamics and predicting future price movements in UNH stock. By analyzing wave patterns, traders can identify potential entry and exit points, enhancing their trading strategies.
-
Daily Chart Strategy: Traders should monitor for any signs of sustained movement above the $500 support level. A stable ascent towards TL8 would confirm the bullish outlook, providing a clear signal for potential long-term investments.
-
4-Hour Chart Trading Tips: The completion of wave (i) and the subsequent pullback in wave (ii) on the 4-hour chart present tactical entry opportunities for traders. Investing during the pullback with an anticipation of an upward wave (iii) can offer attractive returns.
Technical Analyst: Malik Awais
Source: visit Tradinglounge.com and learn From the Experts Join TradingLounge Here
See Previous: The TJX Companies Inc. (TJX) Elliott Wave Analysis
Special Trial Offer - 0.76 Cents a Day for 3 Months! Click here
Access 6 Analysts covering over 150 Markets. Chat Room With Support
Conclusion
The UNH Elliott Wave Analysis underlines a strong bullish trend in both daily and 4-hour charts, guided by impulsive and motive wave structures. Traders are advised to stay vigilant, watching for key wave completions and pullbacks to make informed trading decisions. By aligning trading actions with these advanced technical insights, traders can enhance their portfolio performance significantly.