Applying Elliott Wave Theory in BNBUSD Cryptocurrency Trading

Elliott Wave Theory is a powerful tool used by traders to predict price movements by identifying recurring wave patterns. In the realm of cryptocurrency, this method has proven invaluable for strategizing trades, especially for dynamic currencies like Binance Coin (BNB) against the U.S. dollar (BNBUSD). Our detailed analysis aims to provide traders with a comprehensive understanding of the current BNBUSD market trends, focusing on the Elliott Wave structure, to aid in making informed trading decisions.

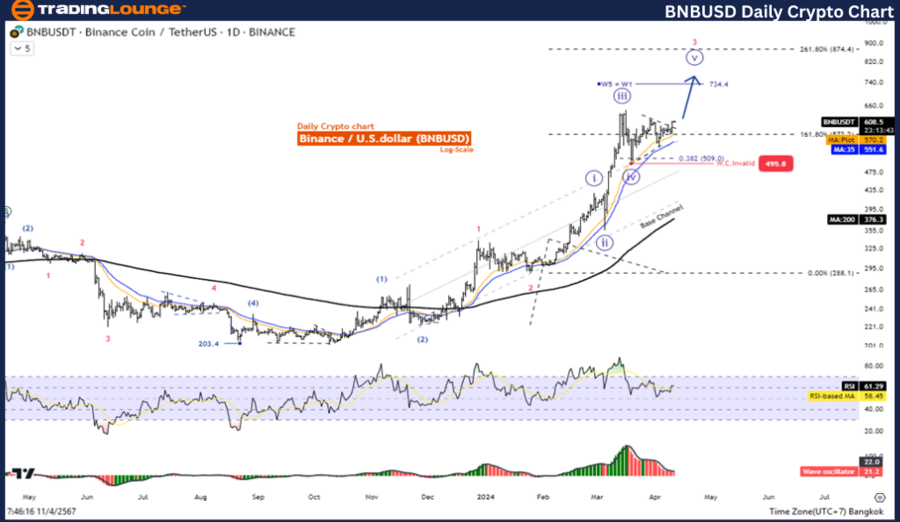
BNBUSD Daily Chart Analysis: A Closer Look at the Impulse Wave

BNBUSD Elliott Wave Technical Analysis

Function: Follow Trend

Mode: Motive

Structure: Impulse

Position: Wave ((v))

Direction Next higher Degrees: wave 3

Wave Cancel invalid level: 287.5

Details: Wave ((V)) is equal to wave ((1) at 734.4

Binance / U.S. dollar(BNBUSD)Trading Strategy:

Binance is still in an uptrend in the form of an Impulse Wave and the price has a chance to test the 734.4 level before correcting again. Therefore, the overall picture is still a continuous increase. Look for opportunities to open long positions.

Binance / U.S. dollar(BNBUSD) Technical Indicators: The price is above the MA200 indicating an Uptrend, and The Wave Oscillator has a Bullish Momentum.


BNBUSD-1D-crypto-cha...


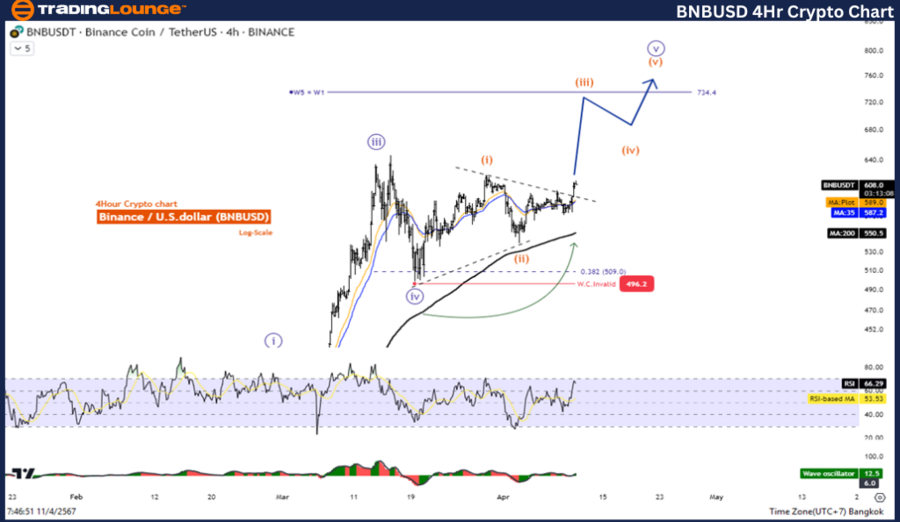
TradingLounge BNBUSD Elliott Wave Analysis: In-Depth 4-Hour Chart Review

Expanding our analysis to a 4-hour chart perspective maintains consistency with the daily chart’s findings. The detailed review underscores the Impulse Wave’s reliability in predicting BNBUSD’s upward movement.

Binance / U.S. dollar(BNBUSD) 4-Hour Chart Analysis

Elliott Wave Technical Analysis of BNBUSD

Function: Follow Trend

Mode: Motive

Structure: Impulse

Position: Wave ((v))

Direction Next higher Degrees: wave 3

Wave Cancel invalid level: 287.5

Details: Wave ((V)) is equal to wave ((1) at 734.4

BNBUSD Trading Strategy: Binance is still in an uptrend in the form of an Impulse Wave and the price has a chance to test the 734.4 level before correcting again. Therefore, the overall picture is still a continuous increase. Look for opportunities to open long positions.

BNBUSD Technical Indicators: The price is above the MA200 indicating an Uptrend, and The Wave Oscillator has a Bullish Momentum.

Conclusion: Leveraging Elliott Wave Theory for BNBUSD Trading

The application of Elliott Wave Theory in analyzing BNBUSD trends offers traders a strategic advantage. With the current Impulse Wave formation signalling continuous growth, the projection towards the 734.4 level becomes a tangible target for traders. Keeping a close eye on the MA200 and Wave Oscillator can further guide trading decisions, enhancing the potential for profitable outcomes. As always, traders must conduct their due diligence and consider multiple analysis methods to refine their trading strategies.

Technical Analyst: Kittiampon Somboonsod

Source: visit Tradinglounge.com and learn From the Experts Join TradingLounge Here 

See Previous: Theta Token/ U.S. dollar(THETAUSD)

TradingLounge Once Off SPECIAL DEAL: Here > 1 month Get 3 months.

TradingLounge's Free Week Extravaganza!

April 14 – 21: Unlock the Doors to Trading Excellence — Absolutely FREE

BNBUSD-4Hr-crypto-ch...

Related

DOW JONES – DJI Index Elliott Wave Forecast Shows Bullish Trend with Wave Count Analysis and Key Invalidation Level at 36,642

DOW JONES – DJI Index Elliott Wave Forecast Shows Bullish Trend with Wave Count Analysis and Key Invalidation Level at 36,642

Dow Jones analysis applies Elliott Wave Theory to identify a strong bullish trend, with active impul...

Read More >
Anticipated Forex Market Shifts: British Pound/U.S. Dollar Currency Pair and GBPUSD Elliott Wave Technical Analysis

Anticipated Forex Market Shifts: British Pound/U.S. Dollar Currency Pair and GBPUSD Elliott Wave Technical Analysis

This comprehensive GBPUSD Elliott Wave analysis delves into the bearish trend on daily and 4-hour ch...

Read More >
Insurance Australia Group IAG Elliott Wave Analysis Reveals Key Resistance Targets Before Major Decline | ASX Stock Forecast

Insurance Australia Group IAG Elliott Wave Analysis Reveals Key Resistance Targets Before Major Decline | ASX Stock Forecast

Insurance Australia Group (ASX:IAG) is completing a B-wave and setting up for a decline. Forecasts s...

Read More >
Visa Inc. (V) Elliott Wave Technical Analysis: Daily and 4Hr Chart Insights 8 February 24

Visa Inc. (V) Elliott Wave Technical Analysis: Daily and 4Hr Chart Insights 8 February 24

Delve into the intricate world of Visa Inc. (V) with our expert Elliott Wave analysis dated 8 Februa...

Read More >
Mastercard Inc. (MA) Elliott Wave Analysis Shows Bullish Wave 3 Targeting $595 and $650 Key Resistance Levels for Traders

Mastercard Inc. (MA) Elliott Wave Analysis Shows Bullish Wave 3 Targeting $595 and $650 Key Resistance Levels for Traders

Mastercard (MA) Elliott Wave analysis forecasts an ongoing bullish move in Wave 3, targeting $595 an...

Read More >
Corn's Bearish Trend and Future Movements in the Commodity Market - Corn Elliott Wave Technical Analysis

Corn's Bearish Trend and Future Movements in the Commodity Market - Corn Elliott Wave Technical Analysis

This detailed analysis of corn prices leverages the Elliott Wave theory to forecast market trends. E...

Read More >

$1 for 2 Weeks

then $29 a month!

What a Special Offer!

Trade Recommendations

Unleash the power of deversified trading with our comprehensive portfolio, covering 250+ markets:

  • Stock Trades
  • Crypto Trades
  • Forex Trades
  • Commodity Trades
Elliott Wave Analysis

Gain a competitive edge with expert insights and AI-powered Elliott Wave charting into:

  • Global Indices
  • US Stocks & ASX Stocks
  • Forex & Crypto
  • Commodities
Top-Notch Trading Tools

Equip yourself with the tools of success:

  • Real-time Chat rooms
  • Elliott Wave Algorithm
  • Portfolio tools
  • TradingLevels
  • Screener
  • Trading Game
7 Elliott Wave Analysts

Stay ahead of the market with daily charts and insightful videos
Your secret to strategic trading!

JOIN HERE


Welcome to TradingLounge (ASIC A.R.No. 321187), specialists in trades, trading education and technical analysis, covering stocks, indices, commodities, forex and cryptocurrencies.

When you join TradingLounge you have access to everything we offer, including trade tools, educational content and a social platform to chat with like-minded investors.

Read more

@Copyright 2024 by tradinglounge.com

Contact Us

Australian no: 02 4787 6020

International no: +61 (2) 47876020

Pay with:

Find us on