TATA Consumer Product Stock – TradingLounge (1D Chart)

TATA Consumer Product – TATACONSUM Elliott Wave Technical Analysis

Function: Larger Degree Trend Higher (Intermediate degree, orange)

Mode: Motive

Structure: Impulse

Position: Minor Wave 4

Details: Minor Wave 4 may have developed as a combination, potentially concluding near the 1000 level. If this holds true, Minor Wave 5 is likely to begin soon.

Invalidation Point: 845

Elliott Wave Analyst: Harsh Japee

TATA Consumer Product - Daily Chart Technical Analysis and Potential Elliott Wave Counts:

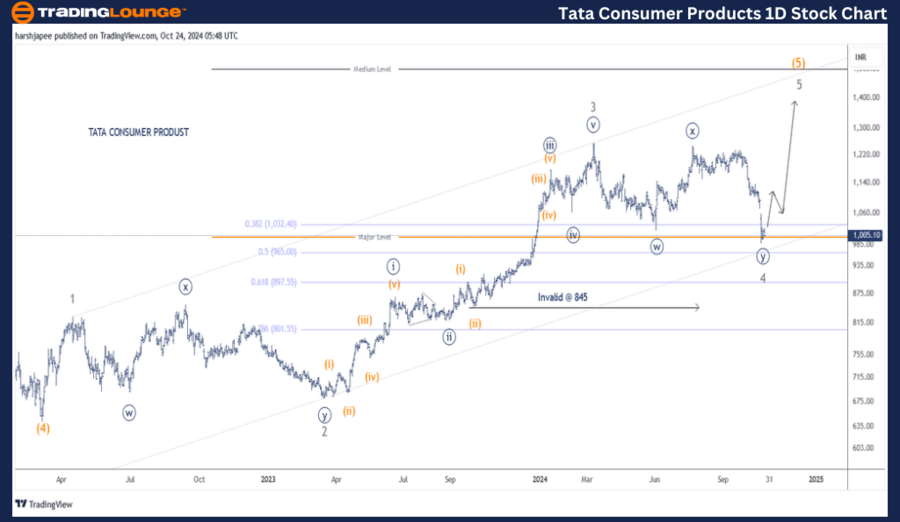
The daily chart of TATA Consumer Product indicates a continued upward momentum as Intermediate Wave (5) Orange evolves. The stock appears poised to surpass the 1255 level as Minor Wave 5 Grey initiates from a point below 1000.

Intermediate Wave (4) Orange concluded near the 640 mark in March 2022. From that point, Minor Waves 1 through 4 have either completed or are close to completion. It’s important to note that the wave counts have been revised since the last update, with Minor Wave 4 now categorized as a combination.

Moreover, the Fibonacci 0.50 retracement and channel support validate the possibility of Wave 4 ending near the 1000 level. If this assumption is correct, Wave 5 Grey should continue its ascent, with a target of breaking above the 1255 mark.
TATA-Consumer-Produc...


TATA Consumer Product Stock – TradingLounge (4H Chart)

TATA CONSUMER PRODUCT – TATACONSUM (4H Chart) Elliott Wave Technical Analysis

Function: Larger Degree Trend Higher (Intermediate degree, orange)

Mode: Motive

Structure: Impulse

Position: Minor Wave 4

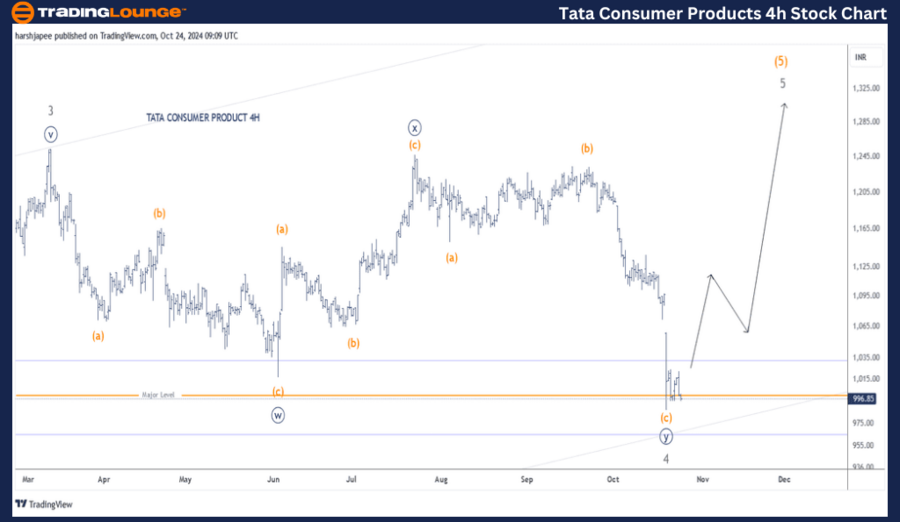
Details: Minor Wave 4 may have unfolded as a combination, ending near the 1000 level. A Minute ((w)) - ((x)) - ((y)) structure has been identified, confirming a 3-3-3 pattern. If correct, Minor Wave 5 should soon begin its upward move.

Invalidation Point: 845

TATA Consumer Product - 4H Chart Technical Analysis and Potential Elliott Wave Counts:

The 4H chart of TATA Consumer Product outlines the sub-waves between Minor Waves 3 and 4 Grey. This structure is identified as a 3-3-3 pattern, labeled Minute Waves ((w)) - ((x)) - ((y)), between the 1255 and 990 levels. If this pattern holds, the stock is expected to rise from its current levels as Minor Wave 5 starts to form.

Technical Analyst: Harsh Japee

Source: visit Tradinglounge.com and learn From the Experts Join TradingLounge Here 

Previous: Reliance Industries Elliott Wave Technical Analysis

VALUE Offer - Buy 1 Month & Get 3 Months!Click here

Access 7 Analysts Over 200 Markets Covered. Chat Room With Support
TATA-Consumer-Produc...


Conclusion:

TATA Consumer Product seems to have completed Minor Wave 4 around the 1000 level as a combination. If this is accurate, Minor Wave 5 Grey should be in progress, pushing the stock higher.

Related

Neo/ U.S. dollar(NEOUSD) Elliott Wave Technical Analysis 16 November 23

Neo/ U.S. dollar(NEOUSD) Elliott Wave Technical Analysis 16 November 23

Neo/ U.S. dollar(NEOUSD) Elliott Wave Technical Analysis 16 November 23 offers an in-depth perspecti...

Read More >
McDonald’s Corp.(MCD:NYSE) Elliott Wave Technical Analysis 25 January 24

McDonald’s Corp.(MCD:NYSE) Elliott Wave Technical Analysis 25 January 24

McDonald’s Corp.(MCD: NYSE) Elliot Wave Technical Analysis 1-Hour and 4-Hour Chart of dated 25 Janu...

Read More >
Commodity Market Elliott Wave Analysis: Bitcoin, Dollar, Gold, Silver, and Crude Oil Insights

Commodity Market Elliott Wave Analysis: Bitcoin, Dollar, Gold, Silver, and Crude Oil Insights

Explore the latest Elliott Wave analysis update for commodity markets, covering Bitcoin, DXY, Gold, ...

Read More >
U.S. Dollar/Swiss Franc (USDCHF) Forex Elliott Wave Technical Analysis: Detailed market insights and potential price movements

U.S. Dollar/Swiss Franc (USDCHF) Forex Elliott Wave Technical Analysis: Detailed market insights and potential price movements

This article provides a comprehensive analysis of the USDCHF currency pair using Elliott Wave Theory...

Read More >
S&P/TSX 60 Index Elliott Wave Technical Analysis Shows Reinforcing the overall Bullish Outlook in both Daily and Weekly Charts

S&P/TSX 60 Index Elliott Wave Technical Analysis Shows Reinforcing the overall Bullish Outlook in both Daily and Weekly Charts

The S&P/TSX 60 is in a bullish trend, according to Elliott Wave analysis. Gray wave 2 of orange wave...

Read More >
Spotify Technology S.A. Stocks Elliott Wave Technical Analysis: Evaluate Current Trends and Forecast SPOT’s Future Price Direction

Spotify Technology S.A. Stocks Elliott Wave Technical Analysis: Evaluate Current Trends and Forecast SPOT’s Future Price Direction

This in-depth Spotify stock analysis applies Elliott Wave Theory to evaluate current trends and fore...

Read More >

Buy 1 Month

Get 3 Months!

Special Offer:

Trade Recommendations

Unleash the power of deversified trading with our comprehensive portfolio, covering:

  • Stock Trades
  • Crypto Trades
  • Forex Trades
  • Commodity Trades
Elliott Wave Analysis

Gain a competive edge with expert insights in to:

  • Global Indices
  • US Stocks & ASX Stocks
  • Forex & Crypto
  • Commodities
Top-Notch Trading Tools

Equip yourself with the tools of success:

  • Social Chat
  • Elliott Wave Algorithm
  • Screener
  • TradingLevels
  • Trading Game
7 Elliott Wave Analysts

Stay ahead of the market with daily charts and insightful videos
-Your secret to strategic trading!

JOIN HERE


Welcome to TradingLounge (ASIC A.R.No. 321187), specialists in trades, trading education and technical analysis, covering stocks, indices, commodities, forex and cryptocurrencies.

When you join TradingLounge you have access to everything we offer, including trade tools, educational content and a social platform to chat with like-minded investors.

Read more

@Copyright 2024 by tradinglounge.com

Contact Us

Australian no: 02 4787 6020

International no: +61 (2) 47876020

Pay with:

Find us on