29May

Newmont Corporation (ASX: NEM) Elliott Wave Analysis Reveals Bullish Wave 3 Trend with Key Price Targets and Technical Insights

ASX: NEWMONT CORPORATION – NEM Elliott Wave Technical Analysis | TradingLounge (1D Chart)

Greetings,
This Elliott Wave update examines Newmont Corporation (ASX:NEM) listed on the Australian Stock Exchange. A bullish trend is identified, with ASX:NEM currently advancing through Wave 3. This technical analysis outlines key targets and invalidation levels to determine where the bullish trend remains valid and where it could potentially reverse.

ASX: NEWMONT CORPORATION – NEM 1D Chart Analysis (Semilog Scale)

Function: Primary trend (Minor degree, grey)

Mode: Motive

Structure: Impulse

Position: Wave iii) orange within Wave iii) navy of Wave 3 grey

Details: Wave ii) orange most likely ended at the 74.25 low, completing a zigzag correction (a-b-c in grey). Following this, Wave iii) orange has shown upward momentum with a projected resistance target near the 100.00 level.

Invalidation Point: 74.25

NEM-d-chart-asx-2905...


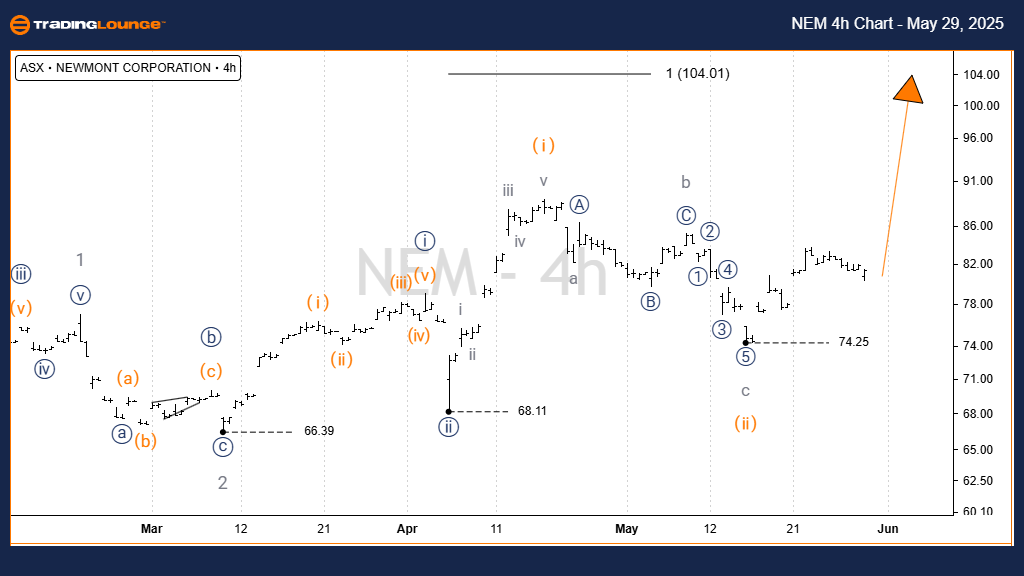
ASX: NEM Elliott Wave Analysis | TradingLounge (4-Hour Chart)

Function: Primary trend (Minor degree, grey)

Mode: Motive

Structure: Impulse

Position: Wave iii) orange within Wave ((iii)) navy of Wave 3 grey

Details:
The 4-hour chart supports the bullish case, confirming that Wave iii) orange is still progressing. The medium-term Elliott Wave price target remains 100.00, while the short-term resistance level is estimated around 90.00 for Wave iii grey.
Invalidation Point: 74.25

Technical Analyst: Hua (Shane) Cuong, CEWA-M (Master’s Designation).

Source: Visit Tradinglounge.com and learn from the Experts. Join TradingLounge Here 

See Previous: COH Elliott Wave Technical Analysis

VALUE Offer - Buy 1 Month & Get 3 Months!Click here

Access 7 Analysts Over 200 Markets Covered. Chat Room With Support

NEM-4h-chart-asx-290...


Conclusion

This Elliott Wave forecast for ASX:NEM offers valuable insight into the continuation of the bullish trend. The defined targets and invalidation levels deliver actionable trading signals for technical traders. Our analysis ensures a structured approach for interpreting Newmont Corporation's market momentum on the ASX, supporting precise and confident trading decisions.

Related

WTI Crudeoil Elliott Wave Analysis: Crude Oil Price Forecast, Support & Resistance Levels, and Trading Strategy Insights

WTI Crudeoil Elliott Wave Analysis: Crude Oil Price Forecast, Support & Resistance Levels, and Trading Strategy Insights

WTI Elliott Wave analysis of crude oil price trends and potential movements based on technical chart...

Read More >
Grasim Industries Elliott Wave Forecast: Chart Analysis Shows Bullish Momentum and Strong Upside in Indian Stock Market

Grasim Industries Elliott Wave Forecast: Chart Analysis Shows Bullish Momentum and Strong Upside in Indian Stock Market

Grasim Industries shows a bullish Elliott Wave pattern on both daily and weekly charts, forecasting ...

Read More >
Fortinet Inc. (FTNT) Wave 2 Bottom Nearing Completion, Breakout Above $100 Confirms Bullish Wave 3 Trend Setup

Fortinet Inc. (FTNT) Wave 2 Bottom Nearing Completion, Breakout Above $100 Confirms Bullish Wave 3 Trend Setup

Fortinet (FTNT) shows a completed wave 1 and ongoing wave 2 correction. A move above $100 confirms w...

Read More >
"Elliott Wave Analysis of Key Indices: S&P 500, NASDAQ 100, Russell 2000, DJI, DAX 40, FTSE 100, ASX 200, and Nikkei"

"Elliott Wave Analysis of Key Indices: S&P 500, NASDAQ 100, Russell 2000, DJI, DAX 40, FTSE 100, ASX 200, and Nikkei"

"Delve into our detailed Elliott Wave Analysis of the Stock Market, focusing on key indices i...

Read More >
Salesforce Inc. (CRM) Elliott Wave Analysis: Salesforce Stock Trends, Bullish Forecasts, and Technical Insights for Smarter Trading

Salesforce Inc. (CRM) Elliott Wave Analysis: Salesforce Stock Trends, Bullish Forecasts, and Technical Insights for Smarter Trading

CRM Elliott Wave Analysis focusing on Salesforce stock trends and technical patterns. This analysis ...

Read More >
Enhance your Forex Trading Strategies With New Zealand Dollar/U.S. Dollar (NZDUSD) Forex Elliott Wave Technical Analysis

Enhance your Forex Trading Strategies With New Zealand Dollar/U.S. Dollar (NZDUSD) Forex Elliott Wave Technical Analysis

Our detailed Elliott Wave analysis gives a comprehensive understanding of the NZDUSD currency pair. ...

Read More >

Buy 1 Month

Get 3 Months!

Special Offer:

Trade Recommendations

Unleash the power of deversified trading with our comprehensive portfolio, covering:

  • Stock Trades
  • Crypto Trades
  • Forex Trades
  • Commodity Trades
Elliott Wave Analysis

Gain a competive edge with expert insights in to:

  • Global Indices
  • US Stocks & ASX Stocks
  • Forex & Crypto
  • Commodities
Top-Notch Trading Tools

Equip yourself with the tools of success:

  • Social Chat
  • Elliott Wave Algorithm
  • Screener
  • TradingLevels
  • Trading Game
7 Elliott Wave Analysts

Stay ahead of the market with daily charts and insightful videos
-Your secret to strategic trading!

JOIN HERE


Welcome to TradingLounge (ASIC A.R.No. 321187), specialists in trades, trading education and technical analysis, covering stocks, indices, commodities, forex and cryptocurrencies.

When you join TradingLounge you have access to everything we offer, including trade tools, educational content and a social platform to chat with like-minded investors.

Read more

@Copyright 2024 by tradinglounge.com

Contact Us

Australian no: 02 4787 6020

International no: +61 (2) 47876020

Pay with:

Find us on