10Jul

The Boeing Company (BA) Stock Elliott Wave Forecast Shows Bullish Structure With $230 Price Target: Key Analysis for Traders and Investors

BA Elliott Wave Analysis - Trading Lounge Daily Chart

The Boeing Company (BA) Daily Chart Analysis

BA Elliott Wave Technical Analysis

FUNCTION: Trend

MODE: Impulsive

STRUCTURE: Motive

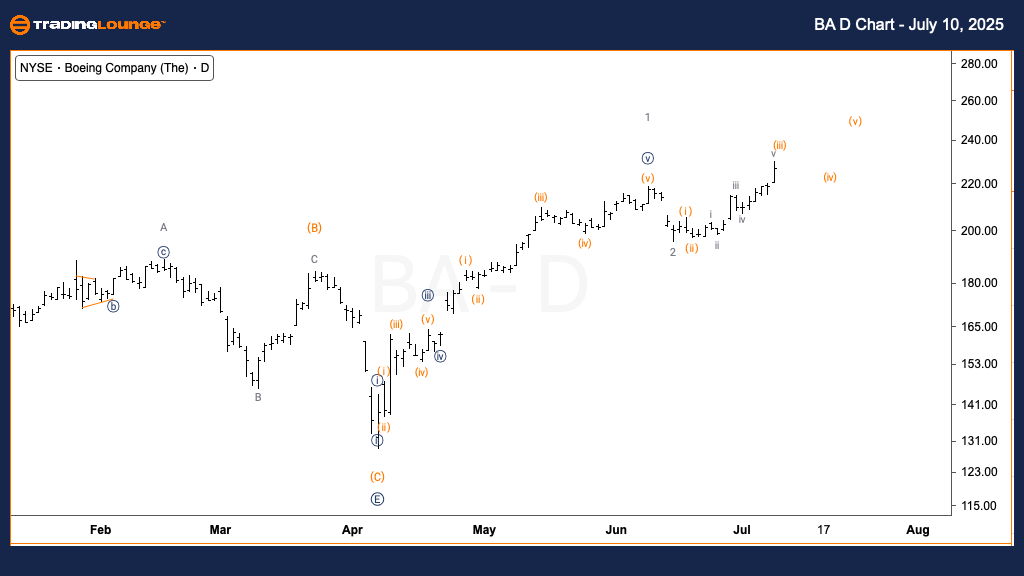
POSITION: Wave {i} of 3

DIRECTION: Upside in Wave {i}

DETAILS: Wave 2 appears to have bottomed sooner than projected, as the stock continues to climb in an impulsive structure.

Daily Chart Overview

The daily Elliott Wave analysis for Boeing stock (NYSE: BA) highlights a bullish trend development. Recent price action suggests wave 2 likely concluded earlier than forecast, allowing wave {i} of 3 to take shape. This indicates the start of a larger impulsive wave cycle. The emerging motive wave structure supports further gains, pointing to increasing bullish momentum and strengthening upside prospects for BA stock.

BA-Stock-D-Chart-100...


The Boeing Company (BA) US Stock 1H Chart Outlook

BA Elliott Wave Technical Analysis

FUNCTION: Trend

MODE: Impulsive

STRUCTURE: Motive

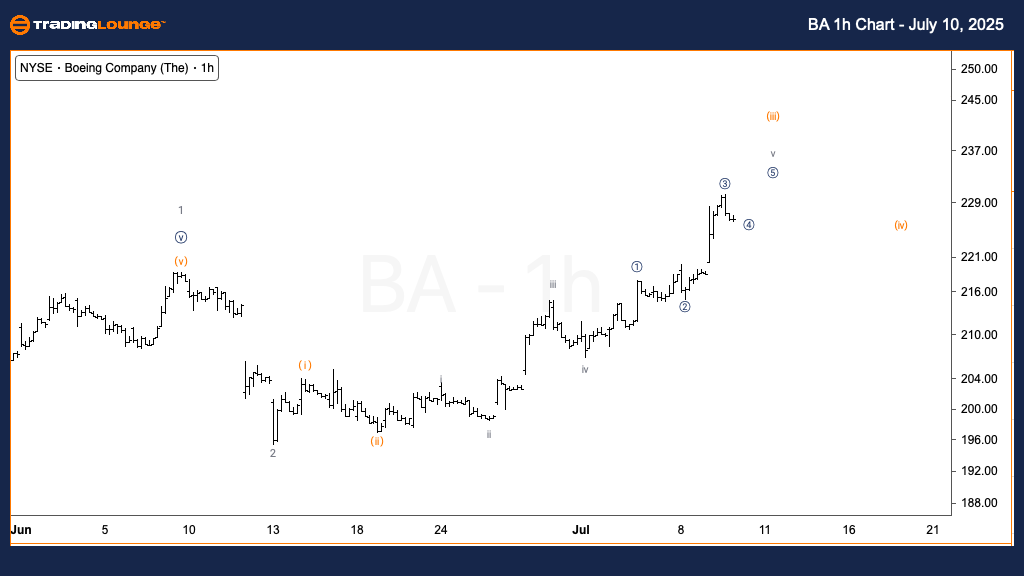
POSITION: Wave v of (iii)

DIRECTION: Upside in Wave v

DETAILS: Wave v is advancing toward the $230 resistance level, a critical zone within MinorGroup1.

1-Hour Chart Analysis

On the 1-hour timeframe, Boeing stock continues its short-term uptrend, currently moving through wave v of (iii). The price is nearing the $230 level, a key resistance area that may define the top of MinorGroup1. This bullish phase is part of an extended impulsive pattern, yet traders should remain cautious. A corrective wave (iv) may follow once this wave v concludes. While upward momentum remains strong, attention to reversal signals near this level is essential.

Technical Analyst: Alessio Barretta

Visit: TradingLounge.com for detailed analysis and market updates.

Previous: SuperMicro Computers Inc. (SMCI) Elliott Wave Technical Analysis

VALUE Offer - $1 for 2 Weeks then $29 a month!Click here

Access 7 Analysts Over 200 Markets Covered. Chat Room With Support

BA-Stock-1h-Chart-10...


Summary
Boeing (BA) is exhibiting a robust impulsive move according to Elliott Wave analysis across both daily and hourly charts. Wave {i} of 3 is in progress on the daily chart, while wave v of (iii) is close to its potential peak on the 1H chart. With the $230 resistance level acting as a pivotal zone, traders should monitor for potential trend continuations or pullbacks. The current wave structure supports further upside in Boeing stock price in the near term.

Related

Forex Market Forecasts for AUDJPY Elliott Wave Analysis: Trading Strategy with the Australian Dollar to Japanese Yen pair

Forex Market Forecasts for AUDJPY Elliott Wave Analysis: Trading Strategy with the Australian Dollar to Japanese Yen pair

Discover detailed AUDJPY Elliott Wave Analysis for both daily and 4-hour charts, highlighting the on...

Read More >
Current Market Structure and Trading Strategies for MCD: McDonald’s Corp. Stocks Elliott Wave Technical Analysis

Current Market Structure and Trading Strategies for MCD: McDonald’s Corp. Stocks Elliott Wave Technical Analysis

Get comprehensive insights into McDonald's stock with our detailed Elliott Wave analysis. Learn ...

Read More >
Elliott Wave Technical Analysis of AAVE/USD: Navigating the Wave Patterns for Strategic Trading

Elliott Wave Technical Analysis of AAVE/USD: Navigating the Wave Patterns for Strategic Trading

This article provides an in-depth Elliott Wave Analysis of the AAVE/USD cryptocurrency pair, offerin...

Read More >
Gold XAUUSD Commodity Elliott Wave Technical Analysis:Assessing the Current Trend and Structure

Gold XAUUSD Commodity Elliott Wave Technical Analysis:Assessing the Current Trend and Structure

Gold Elliott Wave Analysis, identifying the crucial stages of the current impulse wave sequence and ...

Read More >

$1 for 2 Weeks

then $29 a month!

What a Special Offer!

Trade Recommendations

Unleash the power of deversified trading with our comprehensive portfolio, covering 250+ markets:

  • Stock Trades
  • Crypto Trades
  • Forex Trades
  • Commodity Trades
Elliott Wave Analysis

Gain a competitive edge with expert insights and AI-powered Elliott Wave charting into:

  • Global Indices
  • US Stocks & ASX Stocks
  • Forex & Crypto
  • Commodities
Top-Notch Trading Tools

Equip yourself with the tools of success:

  • Real-time Chat rooms
  • Elliott Wave Algorithm
  • Portfolio tools
  • TradingLevels
  • Screener
  • Trading Game
7 Elliott Wave Analysts

Stay ahead of the market with daily charts and insightful videos
Your secret to strategic trading!

JOIN HERE


Welcome to TradingLounge (ASIC A.R.No. 321187), specialists in trades, trading education and technical analysis, covering stocks, indices, commodities, forex and cryptocurrencies.

When you join TradingLounge you have access to everything we offer, including trade tools, educational content and a social platform to chat with like-minded investors.

Read more

@Copyright 2024 by tradinglounge.com

Contact Us

Australian no: 02 4787 6020

International no: +61 (2) 47876020

Pay with:

Find us on