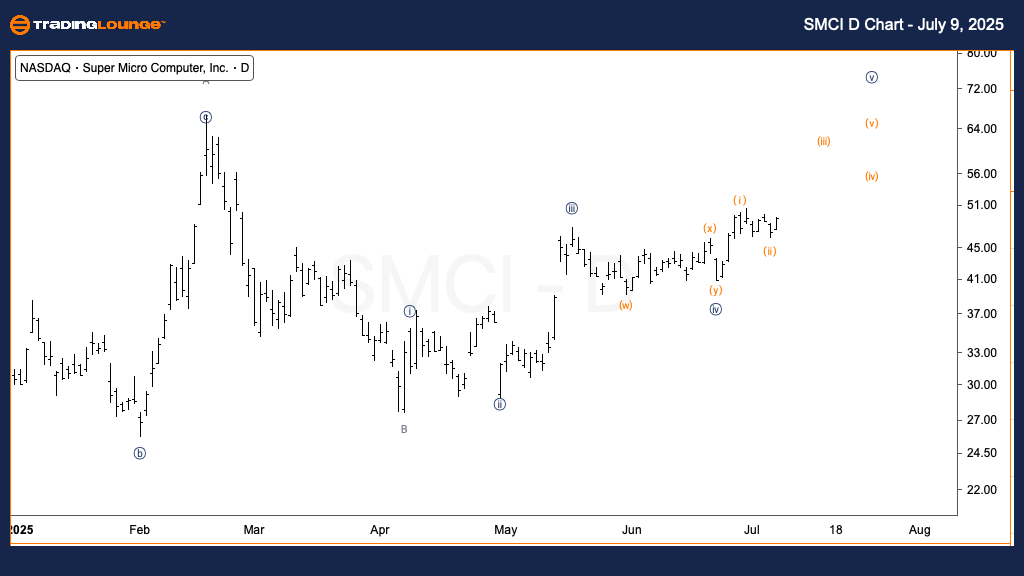
SuperMicro Computers Inc. (SMCI) Elliott Wave Analysis - TradingLounge Daily Chart
SMCI Elliott Wave Technical Analysis
FUNCTION: Countertrend
MODE: Corrective
STRUCTURE: Flat
POSITION: Wave {v} of C
DIRECTION: Upward targeting wave {v}
DETAILS: SMCI has experienced a sustained pullback since early 2025. The latest price movement indicates a potential upward wave, completing the correction phase.
Based on the daily Elliott Wave outlook for SuperMicro Computers Inc. (SMCI), the stock is nearing the end of a corrective flat formation. Currently, SMCI is progressing through wave {v} of C, which likely marks the final upward leg in the correction. This move is expected to complete the countertrend phase and potentially signal a return to the prevailing larger trend. The setup favors bullish momentum as wave {v} advances.
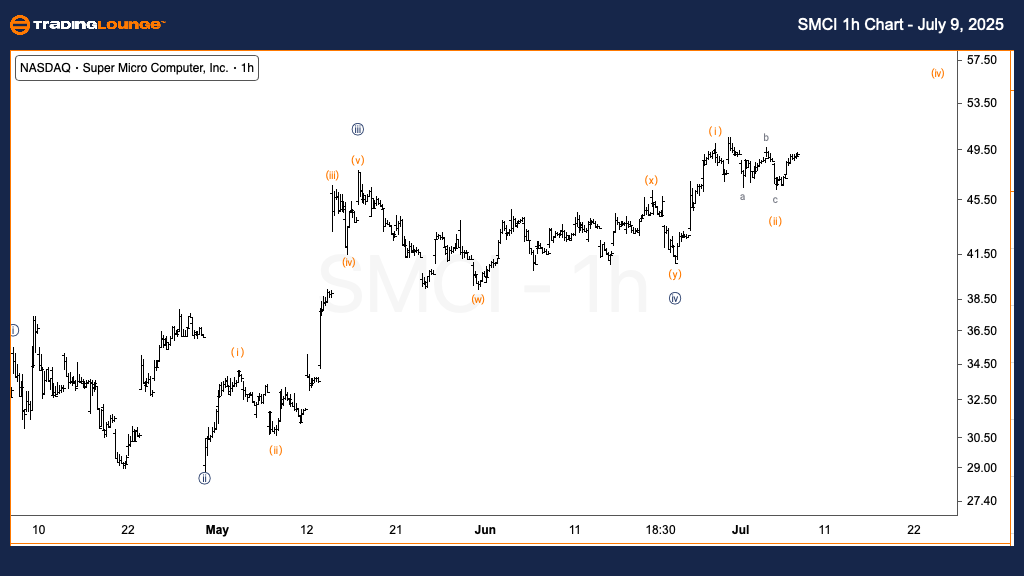
SuperMicro Computers Inc. (SMCI) Elliott Wave Analysis - TradingLounge 1H Chart
SMCI Elliott Wave Technical Analysis
FUNCTION: Countertrend
MODE: Corrective
STRUCTURE: Flat
POSITION: Wave (ii) of {v}
DIRECTION: Upside move into wave (iii)
DETAILS: Wave (ii) seems complete. A breakout above the $50 level would validate the next upward leg.
On the 1-hour chart, SMCI appears to have concluded wave (ii) of {v} and is transitioning into wave (iii). The price is approaching the $50 level, a critical resistance-turned-support zone. Sustaining above this threshold will strengthen the bullish wave count and support the projection of wave (iii) continuation. This development could drive momentum for the final advance in wave C and enhance the near-term bullish outlook for SMCI.
Technical Analyst: Alessio Barretta
Visit: TradingLounge.com for detailed analysis and market updates.
Previous: The Walt Disney Co. (DIS) Elliott Wave Technical Analysis
VALUE Offer - $1 for 2 Weeks then $29 a month!Click here
Access 7 Analysts Over 200 Markets Covered. Chat Room With Support