08Jul

Hang Seng Index Elliott Wave Technical Analysis Bullish Trend: Orange Wave 1 Unfolds with Invalidation Level 19215 for Trade Setup

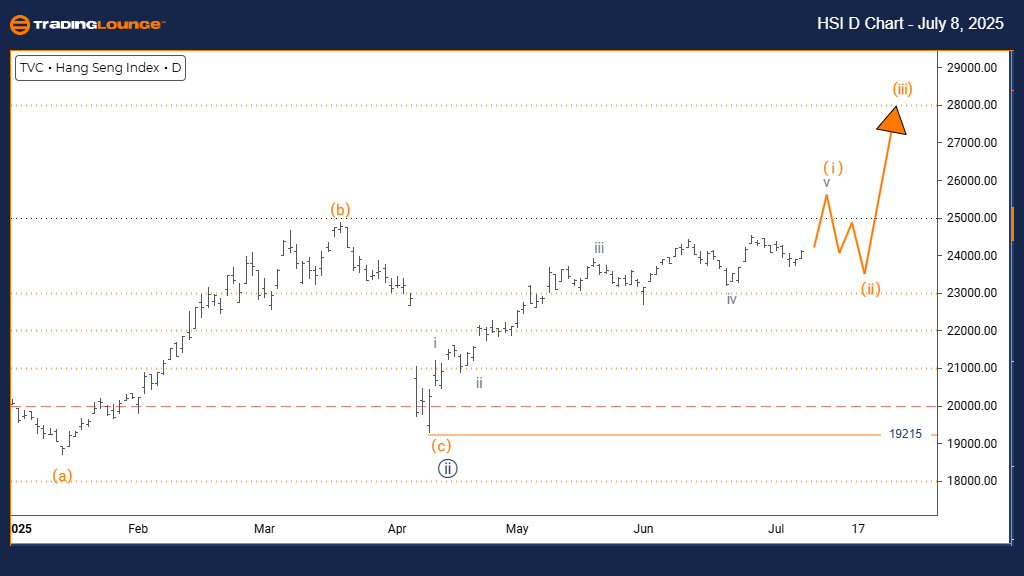
Hang Seng Index Elliott Wave Analysis | Trading Lounge Day Chart

Hang Seng Index Day Chart Analysis

Hang Seng Index Elliott Wave Technical Outlook

FUNCTION: Bullish Market Trend

MODE: Impulsive Wave Formation

STRUCTURE: Orange Wave 1 Initiated

POSITION: Navy Blue Wave 3 Development

DIRECTION (Next Lower Degree): Orange Wave 2 Projection

DETAILS:
The Hang Seng Index daily chart reveals that navy blue wave 2 has likely concluded, and orange wave 1 within navy blue wave 3 is currently progressing.
Key Invalidation Level: 19215

According to Elliott Wave analysis, the Hang Seng Index is exhibiting bullish momentum. The chart structure suggests an impulsive move, where orange wave 1 unfolds as the initial part of navy blue wave 3 — a scenario that often signals a fresh bullish leg.

The end of navy blue wave 2 indicates that buying strength is building. The emergence of orange wave 1 points to early-stage upward pressure, supporting a continuation of the current bullish bias. As long as prices remain above the 19215 invalidation level, this setup holds potential for further gains.

This segment is crucial for swing traders and short-term investors, as the upcoming orange wave 2 correction could provide another buying opportunity. Being positioned within navy blue wave 3 suggests the market might experience a sustained upward breakout in the near term.

HSI-D-Chart-080725


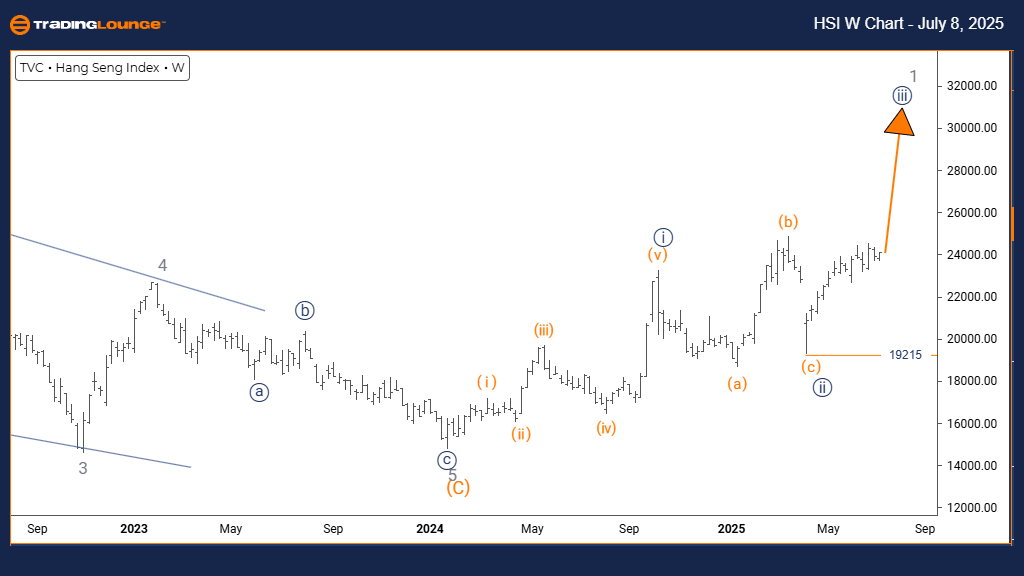
Hang Seng Index Elliott Wave Analysis | Trading Lounge Weekly Chart

Hang Seng Index Elliott Wave Technical Forecast

FUNCTION: Long-Term Bullish Trend

MODE: Impulsive Structure Forming

STRUCTURE: Navy Blue Wave 3 In Progress

POSITION: Gray Wave 1 Cycle

DIRECTION (Next Lower Degree): Navy Blue Wave 4 Anticipation

DETAILS:
The weekly chart of the Hang Seng Index indicates that navy blue wave 2 has ended, and navy blue wave 3 is actively developing.
Key Invalidation Level: 19215

The long-term Elliott Wave view of the Hang Seng Index confirms a strong bullish outlook. The impulsive phase within navy blue wave 3 signals the start of a robust upward cycle under gray wave 1. This aligns with expectations of a multi-week rally.

Since completing navy blue wave 2, price momentum has shifted into navy blue wave 3 — typically the most forceful in the Elliott Wave count. With continued higher highs and higher lows, the index signals investor confidence and potential price acceleration. A move below 19215 would challenge this wave scenario.

As long as the Hang Seng Index trades above the invalidation point, bullish positions remain supported. The wave 4 correction is expected later in the sequence, offering intermediate pullbacks within the broader uptrend.

The weekly timeframe adds strategic weight to the analysis, highlighting a larger bullish cycle supported by solid technical patterns. This stage presents favorable conditions for medium- to long-term positioning.

Technical Analyst: Malik Awais

Source: Visit Tradinglounge.com and learn from the Experts. Join TradingLounge Here

Previous: RUSSELL 2000 Elliott Wave Technical Analysis

VALUE Offer - $1 for 2 Weeks then $29 a month!Click here

Access 7 Analysts Over 200 Markets Covered. Chat Room With Support

HSI-W-Chart-080725

Related

Coffee Commodity Elliottwave Technical analysis: Mastering Bullish Trends & Trading Strategies

Coffee Commodity Elliottwave Technical analysis: Mastering Bullish Trends & Trading Strategies

This guide offers an in-depth exploration of the Elliott wave analysis in the context of the coffee ...

Read More >
EURGBP Elliott Wave Counter‑Trend Setup: Impulsive Gray Wave A within Orange Wave Y with Navy Blue Wave 4 correction insights

EURGBP Elliott Wave Counter‑Trend Setup: Impulsive Gray Wave A within Orange Wave Y with Navy Blue Wave 4 correction insights

This article provides a detailed EURGBP Elliott Wave analysis on both daily and 4‑hour charts. High...

Read More >
S&P/TSX 60 Index Elliott Wave Technical Analysis Shows Reinforcing the overall Bullish Outlook in both Daily and Weekly Charts

S&P/TSX 60 Index Elliott Wave Technical Analysis Shows Reinforcing the overall Bullish Outlook in both Daily and Weekly Charts

The S&P/TSX 60 is in a bullish trend, according to Elliott Wave analysis. Gray wave 2 of orange wave...

Read More >
Fortinet Inc.(FTNT:NYSE) Elliott Wave Technical Analysis 15 December 23

Fortinet Inc.(FTNT:NYSE) Elliott Wave Technical Analysis 15 December 23

Fortinet Inc.(FTNT: NYSE) Elliott Wave Technical Analysis dated 15 December 23, FTNT Stock Market An...

Read More >
ASX MINERAL RESOURCES LIMITED - MIN Elliott Wave Technical Analysis: Confirmed Wave 4 Low, Bullish Wave 5 Rally

ASX MINERAL RESOURCES LIMITED - MIN Elliott Wave Technical Analysis: Confirmed Wave 4 Low, Bullish Wave 5 Rally

Elliott Wave technical analysis of ASX:MIN (Mineral Resources). It confirms the completion of Wave 4...

Read More >

$1 for 2 Weeks

then $29 a month!

What a Special Offer!

Trade Recommendations

Unleash the power of deversified trading with our comprehensive portfolio, covering 250+ markets:

  • Stock Trades
  • Crypto Trades
  • Forex Trades
  • Commodity Trades
Elliott Wave Analysis

Gain a competitive edge with expert insights and AI-powered Elliott Wave charting into:

  • Global Indices
  • US Stocks & ASX Stocks
  • Forex & Crypto
  • Commodities
Top-Notch Trading Tools

Equip yourself with the tools of success:

  • Real-time Chat rooms
  • Elliott Wave Algorithm
  • Portfolio tools
  • TradingLevels
  • Screener
  • Trading Game
7 Elliott Wave Analysts

Stay ahead of the market with daily charts and insightful videos
Your secret to strategic trading!

JOIN HERE


Welcome to TradingLounge (ASIC A.R.No. 321187), specialists in trades, trading education and technical analysis, covering stocks, indices, commodities, forex and cryptocurrencies.

When you join TradingLounge you have access to everything we offer, including trade tools, educational content and a social platform to chat with like-minded investors.

Read more

@Copyright 2024 by tradinglounge.com

Contact Us

Australian no: 02 4787 6020

International no: +61 (2) 47876020

Pay with:

Find us on