26Jan

Johnson & Johnson (JNJ:NYSE) Elliott Wave Technical Analysis 26 January 24

Johnson & Johnson, Elliott Wave Technical Analysis

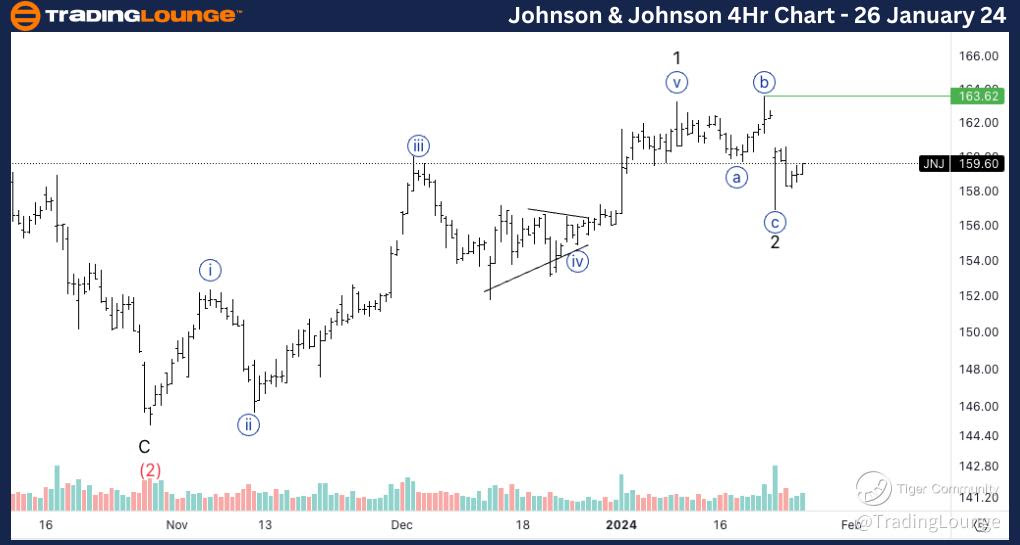
Johnson & Johnson, (JNJ:NYSE): 4h Chart, 26 January 24

JNJ Stock Market Analysis: Looking for upside into wave 3 as we seem to have a three wave move into wave 2. Looking for a break of wave {b} to have additional confirmation.  

JNJ Elliott Wave Count: Wave {c} of 2.  

JNJ Technical Indicators: Between 20EMA and 200EMA, volume increases while price moves higher.  

JNJ Trading Strategy: Looking for a break of {b} of 2 to enter long.  

TradingLounge Analyst: Alessio Barretta

Source: Tradinglounge.com get trial here!

Previous: McDonald’s Corp.

Johnson-&-Johnson-4h...


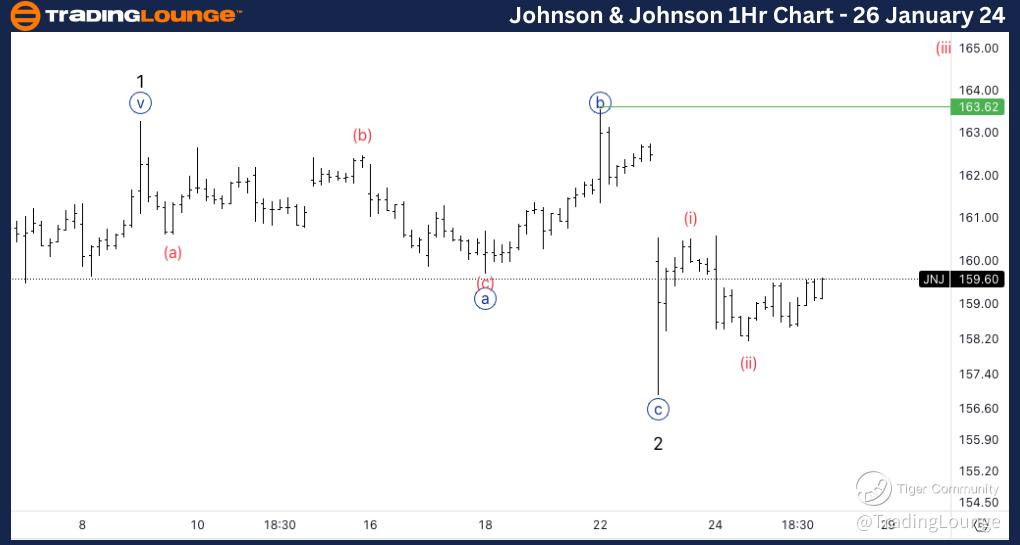
Johnson & Johnson, JNJ: 1-hour Chart, 26 January 24

Johnson & Johnson, Elliott Wave Technical Analysis 

JNJ Stock Market Analysis: Looking for additional upside into wave (iii) of {i}, there is a possibility we are in some sort of wave iv of (c).  

JNJ Elliott Wave count:  Wave {c} of 2.  

JNJ Technical Indicators: 200EMA as support.  

JNJ Trading Strategy: Looking for a break of {b} of 2 to enter long.

Johnson-&-Johnson-1h...

Related

UNIUSD Crypto Price and Elliott Wave Technical Analysis Uniswap's Focusing on Wave Structure and Bullish Momentum

UNIUSD Crypto Price and Elliott Wave Technical Analysis Uniswap's Focusing on Wave Structure and Bullish Momentum

This article provides an in-depth Elliott Wave analysis of Uniswap (UNIUSD), covering price movement...

Read More >
Maximize Gains with Expert NASDAQ Elliott Wave Analysis and Trading Strategies

Maximize Gains with Expert NASDAQ Elliott Wave Analysis and Trading Strategies

Explore our expert Elliott Wave Analysis and trading strategies for NASDAQ 100 (NDX) and leading tec...

Read More >
Vanguard V300AEQ ETF UNITS – VAS Stock Analysis & Elliott Wave Technical Forecast

Vanguard V300AEQ ETF UNITS – VAS Stock Analysis & Elliott Wave Technical Forecast

Unlock the potential of your investments with our in-depth Elliott Wave analysis for ASX VAS ETF. Di...

Read More >
Learn about the best S&P/ASX 200 stocks, index funds, and ETFs: S&P/ASX 200 Index Elliott Wave Technical Analysis

Learn about the best S&P/ASX 200 stocks, index funds, and ETFs: S&P/ASX 200 Index Elliott Wave Technical Analysis

Discover in-depth S&P/ASX 200 trading insights, featuring Elliott Wave analysis, market forecasts, a...

Read More >
Elliott Wave Analysis: S&P 500, NASDAQ 100, DAX 40, FTSE 100, ASX 200.

Elliott Wave Analysis: S&P 500, NASDAQ 100, DAX 40, FTSE 100, ASX 200.

TradingLounge delivers expert Elliott Wave analysis and actionable trading setups across key indices...

Read More >

$1 for 2 Weeks

then $29 a month!

What a Special Offer!

Trade Recommendations

Unleash the power of deversified trading with our comprehensive portfolio, covering 250+ markets:

  • Stock Trades
  • Crypto Trades
  • Forex Trades
  • Commodity Trades
Elliott Wave Analysis

Gain a competitive edge with expert insights and AI-powered Elliott Wave charting into:

  • Global Indices
  • US Stocks & ASX Stocks
  • Forex & Crypto
  • Commodities
Top-Notch Trading Tools

Equip yourself with the tools of success:

  • Real-time Chat rooms
  • Elliott Wave Algorithm
  • Portfolio tools
  • TradingLevels
  • Screener
  • Trading Game
7 Elliott Wave Analysts

Stay ahead of the market with daily charts and insightful videos
Your secret to strategic trading!

JOIN HERE


Welcome to TradingLounge (ASIC A.R.No. 321187), specialists in trades, trading education and technical analysis, covering stocks, indices, commodities, forex and cryptocurrencies.

When you join TradingLounge you have access to everything we offer, including trade tools, educational content and a social platform to chat with like-minded investors.

Read more

@Copyright 2024 by tradinglounge.com

Contact Us

Australian no: 02 4787 6020

International no: +61 (2) 47876020

Pay with:

Find us on