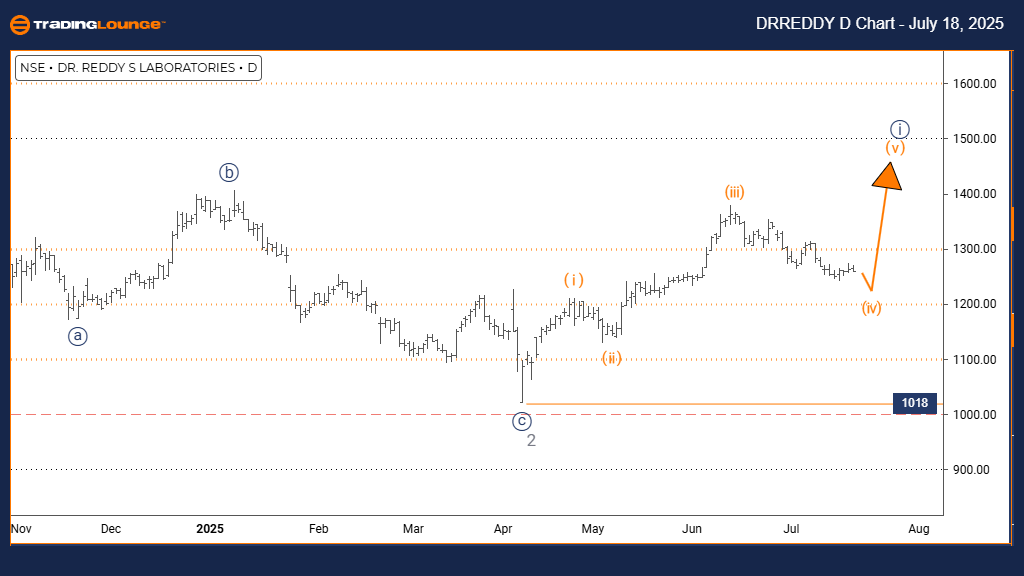
DR REDDY LABORATORIES Elliott Wave Analysis | Trading Lounge Day Chart
DR REDDY LABORATORIES Elliott Wave Technical Analysis
FUNCTION: Counter-Trend
MODE: Corrective
STRUCTURE: Orange Wave 4
POSITION: Navy Blue Wave 1
DIRECTION NEXT LOWER DEGREES: Orange Wave 5
DETAILS: Orange Wave 3 likely completed; Orange Wave 4 currently forming.
Wave Cancel Invalid Level: 1018
The daily Elliott Wave analysis for DR REDDY LABORATORIES stock indicates a corrective counter-trend phase within a larger bullish wave structure. The chart suggests that Orange Wave 4 is unfolding inside Navy Blue Wave 1, following the completion of Orange Wave 3. This phase reflects a standard market correction before the initiation of Orange Wave 5.
This segment of price action is marked by reduced momentum and either sideways movement or a temporary pullback. The 1018 invalidation level is crucial; any move below this would invalidate the current wave structure. It serves as a key confirmation point for the legitimacy of the corrective pattern.
Once Orange Wave 4 concludes, the progression into Orange Wave 5 is expected, continuing the upward sequence. Since this activity exists within Navy Blue Wave 1, it supports the view of a broader bullish trend, where the correction is a minor pause and not a reversal. The daily chart offers context for this retracement, aligning with the overarching upward trend.
This technical Elliott Wave insight is essential for traders aiming to navigate DR REDDY’s stock trends. The current correction phase is less favorable for new trades but signals potential once Wave 5 begins. The chart reaffirms that the correction is part of a healthy wave progression, not a sign of trend exhaustion.
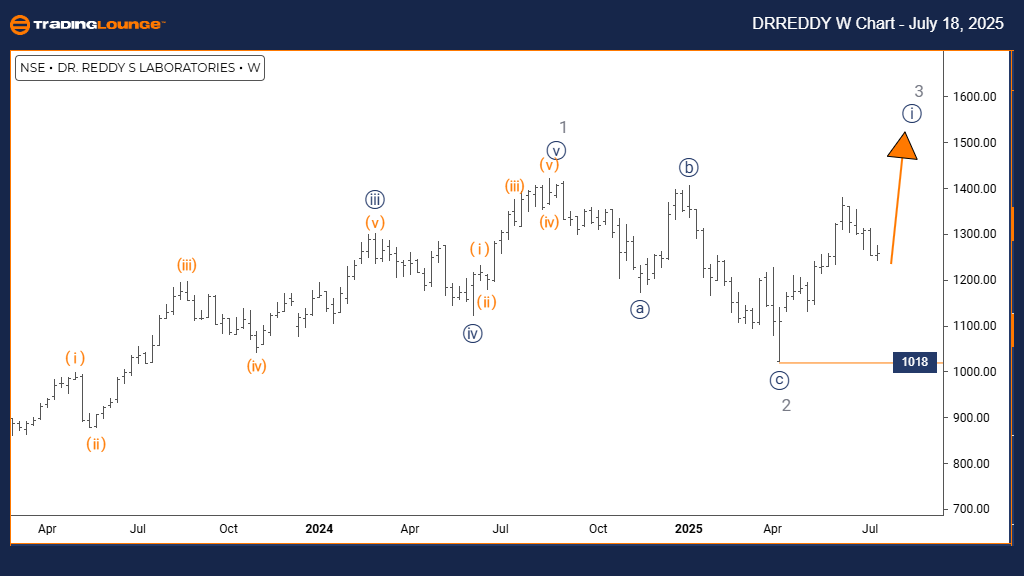
DR REDDY LABORATORIES Elliott Wave Analysis | Trading Lounge Weekly Chart
DR REDDY LABORATORIES Elliott Wave Technical Analysis
FUNCTION: Bullish Trend
MODE: Impulsive
STRUCTURE: Navy Blue Wave 1
POSITION: Gray Wave 3
DIRECTION NEXT LOWER DEGREES: Navy Blue Wave 2
DETAILS: Gray Wave 2 appears complete; Navy Blue Wave 1 of 3 is now in progress.
Wave Cancel Invalid Level: 1018
The weekly Elliott Wave chart for DR REDDY LABORATORIES presents a clear bullish impulsive structure, with Navy Blue Wave 1 unfolding within Gray Wave 3. Following the end of Gray Wave 2, the stock appears to have entered Navy Blue Wave 1 of 3, suggesting a new upward momentum phase has begun.
This impulsive trend formation is characterized by a series of higher highs, reflecting strength and growing investor confidence. As part of Gray Wave 3, this could mark the beginning of a longer bullish extension. The wave invalidation level at 1018 remains vital; breaching it would disqualify the present wave count.
With the correction phase behind, this weekly Elliott Wave analysis implies the stock is primed for a bullish advance, supported by strong technical indicators. The upward move within Gray Wave 3 signals that the current market cycle favors buyers.
This analysis helps traders identify strategic entry points during minor retracements, while remaining aligned with the larger bullish framework. Monitoring how Navy Blue Wave 1 progresses will offer clues for the initiation of Wave 2, which may present further opportunities. This longer-term view offers traders valuable insight into the price trend potential of DR REDDY stock.
Technical Analyst: Malik Awais
Source: Visit Tradinglounge.com and learn from the Experts. Join TradingLounge Here
Previous: Bharat Electronics Elliott Wave Technical Analysis
VALUE Offer - $1 for 2 Weeks then $29 a month!Click here
Access 7 Analysts Over 200 Markets Covered. Chat Room With Support