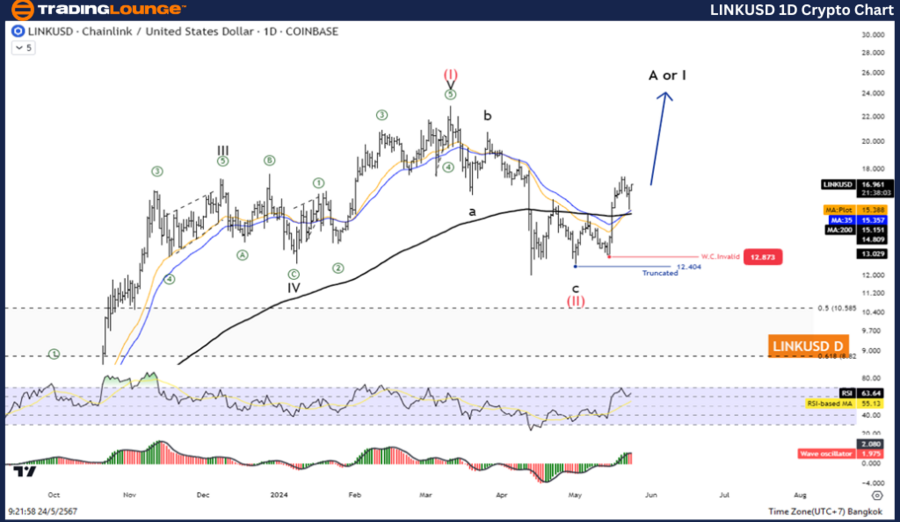
LINKUSD Elliott Wave Analysis: TradingLounge Daily Chart,

ChainLink/ U.S. Dollar (LINKUSD) Daily Crypto Analysis

LINKUSD Elliott Wave Technical Analysis

Function: Counter Trend

Mode: Corrective

Structure: Zigzag

Position: Wave C

Direction Next Higher Degrees: Wave (I) of Impulse

Wave Cancel Invalid Level: 8.498

Details: Wave C may be complete, suggesting the price could increase again in Wave A or I.

ChainLink/ U.S. Dollar (LINKUSD) Trading Strategy

The correction wave (II) seems to have ended. The price is now rising in wave (III), indicating a five-wave increase in the Impulse pattern. This is expected to keep the price above the 24.00 level.

ChainLink/ U.S. Dollar (LINKUSD) Technical Indicators

  • MA200: The price is above the MA200, indicating an uptrend.
  • Wave Oscillator: Shows bullish momentum.

LINKUSD Daily Chart Analysis

On the daily chart, LINKUSD is currently in Wave C of a Zigzag correction. The wave cancel invalid level is set at 8.498, meaning if the price drops below this level, the current wave count will be invalidated. However, given that Wave C may be complete, we expect the price to rise, transitioning into Wave A or I of a new impulse wave.

LINKUSD-1D-Crypto-Ch...


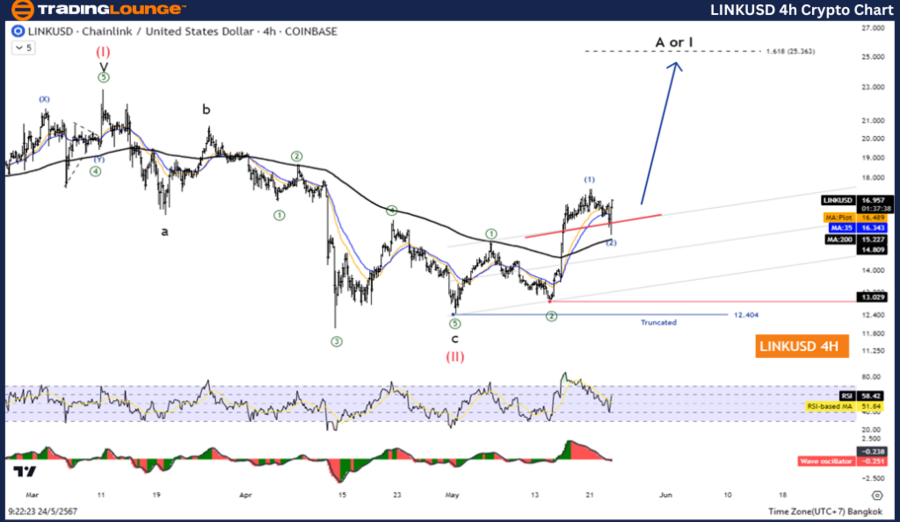
LINKUSD Elliott Wave Analysis: TradingLounge H4 Chart,

ChainLink/ U.S. Dollar (LINKUSD) 4-Hour Chart Analysis

LINKUSD Elliott Wave Technical Analysis

Function: Counter Trend

Mode: Corrective

Structure: Zigzag

Position: Wave C

Direction Next Higher Degrees: Wave (I) of Impulse

Wave Cancel Invalid Level: 8.498

Details: Wave C may be complete, suggesting the price could increase again in Wave A or I.

ChainLink/ U.S. Dollar (LINKUSD) Trading Strategy

The correction wave (II) appears to have ended. The price is rising in wave (III), focusing on the five-wave increase in the Impulse pattern, which is likely to remain above the 24.00 level.

ChainLink/ U.S. Dollar (LINKUSD) Technical Indicators

  • MA200: The price is above the MA200, indicating an uptrend.

  • Wave Oscillator: Shows bullish momentum.

LINKUSD H4 Chart Analysis

Similar to the daily chart, the H4 chart also shows LINKUSD in Wave C of a corrective Zigzag pattern. The price has been moving within this pattern, and the completion of Wave C hints at a potential reversal. As Wave (III) begins, traders should monitor the market closely for signs of continued upward movement, ensuring the price remains above critical support levels.

Technical Analyst:  Kittiampon Somboonsod

Source: visit Tradinglounge.com and learn From the Experts Join TradingLounge Here 

See Previous: Ethereum/ U.S. Dollar (ETHUSD) Elliott Wave Technical Analysis

Special Trial Offer - 0.76 Cents a Day for 3 Months! Click here

Access 7 Analysts Over 170 Markets Covered. Chat Room With Support

LINKUSD-4Hr-Crypto-C...

Related

Valuable insights into Euro/U.S. Dollar Forex Trends and Trading Strategies - EURUSD Elliott Wave Technical Analysis

Valuable insights into Euro/U.S. Dollar Forex Trends and Trading Strategies - EURUSD Elliott Wave Technical Analysis

This EURUSD technical analysis provides a detailed Elliott Wave forecast, covering key levels, wave ...

Read More >
Unleash Profits: Elliott Wave Analysis & Strategies for SP500, NASDAQ 100, RUSSELL 2000, DAX 40, FTSE 100, ASX 200

Unleash Profits: Elliott Wave Analysis & Strategies for SP500, NASDAQ 100, RUSSELL 2000, DAX 40, FTSE 100, ASX 200

Stock Market Indices Overview: S&P 500, SPY, NASDAQ 100, QQQ, RUSSELL 2000, DAX 40, FTSE 100, ASX 20...

Read More >
Expert EURGBP Elliott Wave Analysis: Uncover Trends, Forecasts, and Proven Trading Strategies for Success

Expert EURGBP Elliott Wave Analysis: Uncover Trends, Forecasts, and Proven Trading Strategies for Success

This article provides an in-depth EURGBP Elliott Wave analysis, focusing on the current wave count, ...

Read More >
Comprehensive UnitedHealth Group Inc. (UNH) Stock Analysis: Elliott Wave Insights, Technical Forecast, and Trading Strategies

Comprehensive UnitedHealth Group Inc. (UNH) Stock Analysis: Elliott Wave Insights, Technical Forecast, and Trading Strategies

Dive into detailed Elliott Wave analysis for UNH stock, uncovering trend patterns, corrective moveme...

Read More >

Buy 1 Month

Get 3 Months!

Special Offer:

Trade Recommendations

Unleash the power of deversified trading with our comprehensive portfolio, covering:

  • Stock Trades
  • Crypto Trades
  • Forex Trades
  • Commodity Trades
Elliott Wave Analysis

Gain a competive edge with expert insights in to:

  • Global Indices
  • US Stocks & ASX Stocks
  • Forex & Crypto
  • Commodities
Top-Notch Trading Tools

Equip yourself with the tools of success:

  • Social Chat
  • Elliott Wave Algorithm
  • Screener
  • TradingLevels
  • Trading Game
7 Elliott Wave Analysts

Stay ahead of the market with daily charts and insightful videos
-Your secret to strategic trading!

JOIN HERE


Welcome to TradingLounge (ASIC A.R.No. 321187), specialists in trades, trading education and technical analysis, covering stocks, indices, commodities, forex and cryptocurrencies.

When you join TradingLounge you have access to everything we offer, including trade tools, educational content and a social platform to chat with like-minded investors.

Read more

@Copyright 2024 by tradinglounge.com

Contact Us

Australian no: 02 4787 6020

International no: +61 (2) 47876020

Pay with:

Find us on