Silver XAGUSD Commodity Elliott Wave Technical Analysis – Trading Lounge Insight
Silver is undergoing a corrective phase after its sharp rally that began on April 6, 2025. This retracement is now approaching the projected extreme support zone, which signals a possible end to the pullback. A confirmation at this level may initiate a new buying opportunity aligned with the broader bullish market structure.
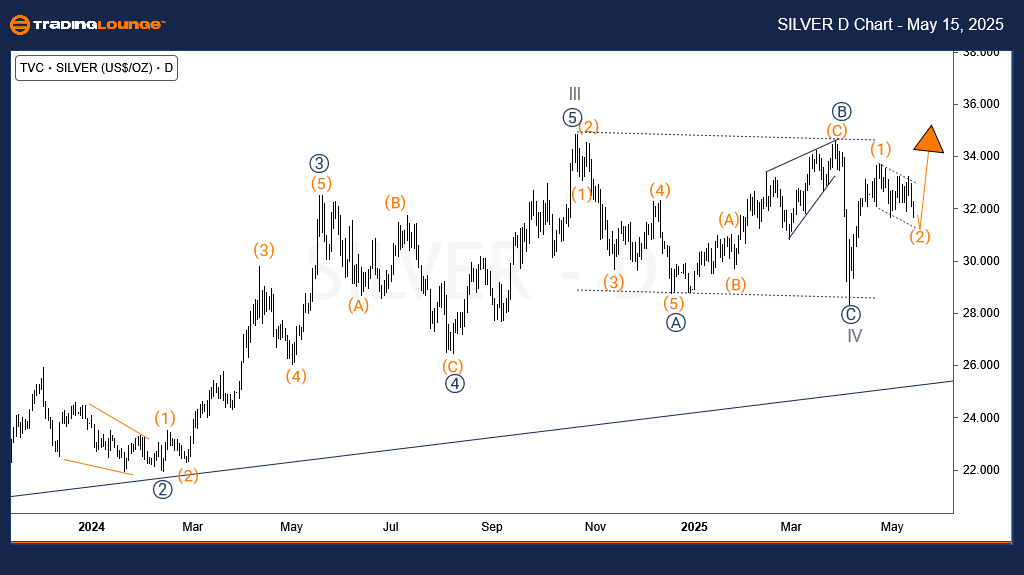
Silver Technical Analysis – Long-Term Daily Wave Count
Compared to Gold, Silver continues to lag. While Gold has broken multiple all-time highs, Silver still trades below its historical April 2011 high of $48.30.
Silver's primary bullish wave sequence, which started in March 2020, remains incomplete. After surpassing the January 2021 highs, the next critical resistance is set in the $35–$36 range. Since this zone has yet to be tested, technical buyers may anticipate entries on corrective dips.
The daily Elliott Wave structure suggests wave IV ended in April 2025 near its designated support zone. A bullish impulsive rally followed, forming wave (1). The market now corrects in wave (2), unfolding through a double zigzag formation. This phase may again act as a catalyst for renewed buying momentum.
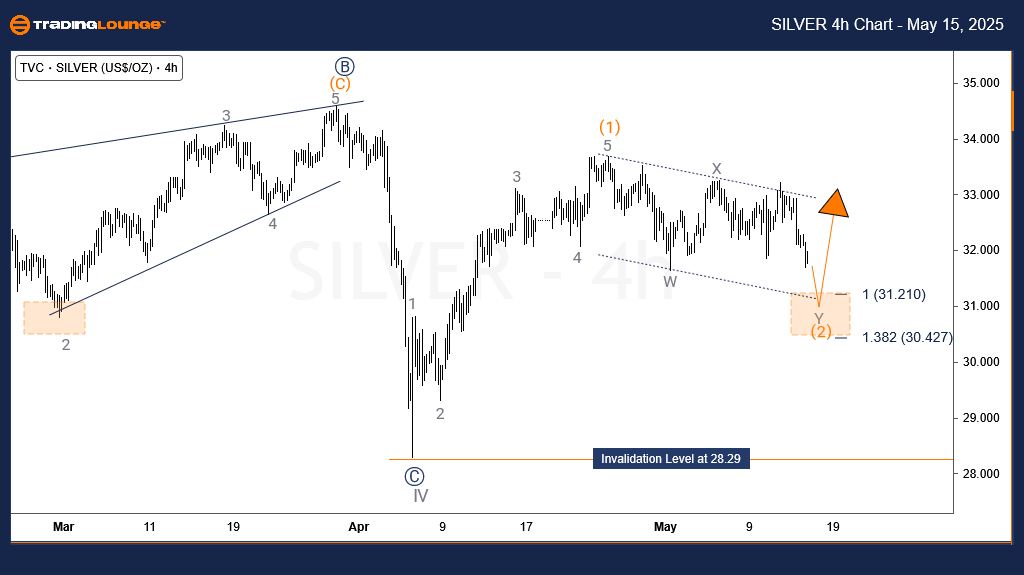
Silver Price Prediction – H4 Elliott Wave Structure
In the 4-hour wave structure, wave (1) has confirmed as a completed bullish impulse, with all internal waves clearly visible. The ongoing corrective wave (2) appears to be developing into a double zigzag pattern.
The expected retracement zone ranges between $31.21 and $30.42, a region where bullish entries could be considered. However, risk management is crucial, and any long positions should maintain a stop-loss below $28.29, should the correction extend beyond its projected limits.
Technical Analyst: Sanmi Adeagbo
Source: Visit Tradinglounge.com and learn from the Experts. Join TradingLounge Here
See Previous: Coffee Elliott Wave Technical Analysis
VALUE Offer - Buy 1 Month & Get 3 Months!Click here
Access 7 Analysts Over 200 Markets Covered. Chat Room With Support