07Jul

ASIAN PAINT Elliott Wave Analysis Reveals Bullish Impulsive Trend in Wave 3 with High Share Price Potential and Key Support Levels

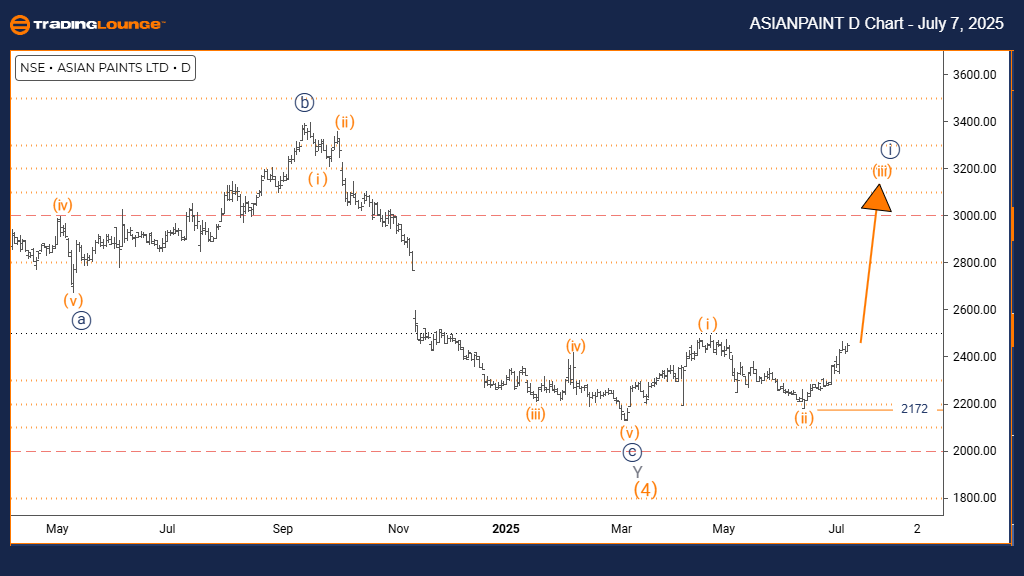
ASIAN PAINT Elliott Wave Analysis | Trading Lounge Day Chart

ASIAN PAINT Elliott Wave Technical Analysis

Function: Bullish Trend

Mode: Impulsive

Structure: Orange Wave 3

Position: Navy Blue Wave 1

Direction Next Higher Degrees: Orange Wave 3 (Initiated)

Details: Completion of Orange Wave 2; Orange Wave 3 in progress

Wave Cancel Invalid Level: 2172

The ASIAN PAINT daily chart analysis using Elliott Wave principles reveals a bullish market outlook. The current price action aligns with an impulsive wave phase, indicating strong upward momentum. The wave configuration, identified as Orange Wave 3, is advancing within the larger framework of Navy Blue Wave 1, reinforcing the strength of the ongoing uptrend.

Technical indicators suggest that Orange Wave 2 has likely ended, initiating the ascent of Orange Wave 3—a stage known for sharp price movements and increased bullish activity. This aligns with typical Elliott Wave behavior, where Wave 3 often brings accelerated gains. The focus now shifts to monitoring the progress of Orange Wave 3 within this upward structure.

Traders should closely monitor the invalidation point set at 2172. A decline below this level would nullify the current wave structure, signaling a need to revise the bullish scenario. As long as the price remains above this key support, the chart favors continued upward movement.

Overall, the current Elliott Wave setup supports a bullish continuation, with Orange Wave 3 likely driving future price appreciation in ASIAN PAINT, making it a candidate for potential short-term gains.

ASIAN-d-indian-chart...


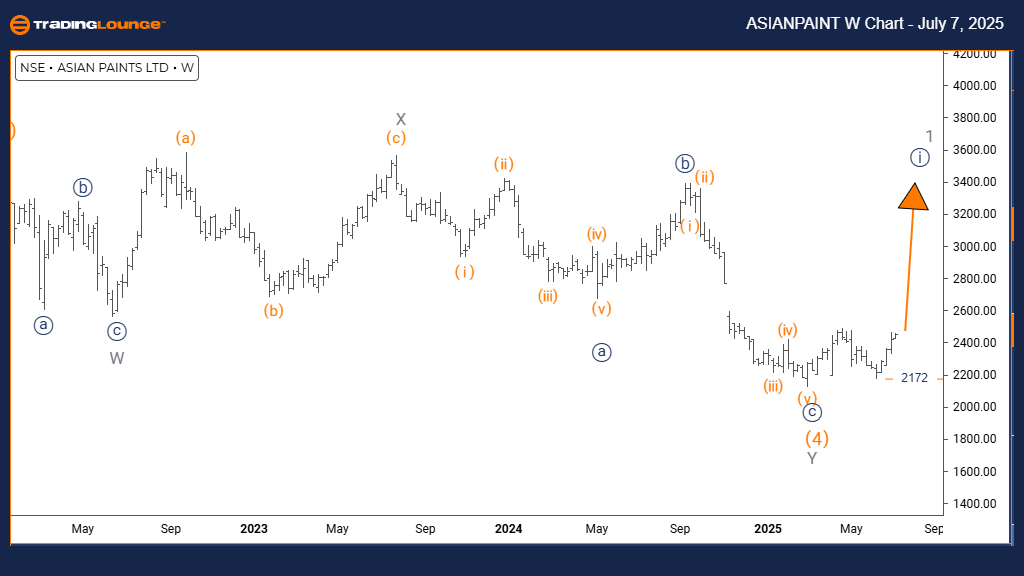
ASIAN PAINT Elliott Wave Analysis | Trading Lounge Weekly Chart

ASIAN PAINT Elliott Wave Technical Analysis

Function: Bullish Trend

Mode: Impulsive

Structure: Navy Blue Wave 1

Position: Gray Wave 1

Direction Next Lower Degrees: Navy Blue Wave 2

Details: Orange Wave 4 has concluded; Navy Blue Wave 1 of 1 advancing

Wave Cancel Invalid Level: 2172

The weekly Elliott Wave analysis of ASIAN PAINT confirms the presence of a bullish trend. The price structure is currently moving in an impulsive manner, characteristic of rising market sentiment. The wave pattern forming Navy Blue Wave 1 is developing within a broader bullish framework identified as Gray Wave 1, signaling a potential long-term uptrend.

Based on the wave count, Orange Wave 4 has likely finalized its corrective path, setting the stage for Navy Blue Wave 1 to emerge. This marks the beginning of a new bullish phase, often driven by increased investor confidence and accumulation. The anticipated follow-up wave is Navy Blue Wave 2, expected to form after the completion of the current upward leg.

A crucial support level is the wave invalidation point at 2172. A fall below this level would necessitate a reassessment of the wave count. Until then, the bullish wave structure remains valid and points to continued price advancement.

In summary, ASIAN PAINT is currently situated in a promising technical setup with Navy Blue Wave 1 unfolding. This supports long-term bullish projections and reflects ongoing institutional interest, which could lead to extended upward price action in alignment with the Gray Wave 1 trajectory.

Technical Analyst: Malik Awais

Source: Visit Tradinglounge.com and learn from the Experts. Join TradingLounge Here

Previous: DR REDDY LABORATORIES Elliott Wave Technical Analysis

VALUE Offer - Buy 1 Month & Get 3 Months!Click here

Access 7 Analysts Over 200 Markets Covered. Chat Room With Support

ASIAN-w-indian-chart...

Related

AXIS BANK Elliott Wave Forecast Highlights Bullish Momentum on Daily and Weekly Charts with Key Trading Levels and Wave Setups

AXIS BANK Elliott Wave Forecast Highlights Bullish Momentum on Daily and Weekly Charts with Key Trading Levels and Wave Setups

AXIS BANK shows a bullish Elliott Wave structure with upward momentum on both daily and weekly chart...

Read More >
MercadoLibre Inc. (MELI) Elliott Wave Analysis Shows Bullish Reversal Setup in Wave (2) With Key Support and Trade Signals

MercadoLibre Inc. (MELI) Elliott Wave Analysis Shows Bullish Reversal Setup in Wave (2) With Key Support and Trade Signals

Elliott Wave breakdown of MercadoLibre Inc. (MELI) explores both daily and intraday charts, indicati...

Read More >
Delves into the Cocoa Commodity Market Analysis through Elliott Wave Theory, Focusing on the Current Corrective Phase

Delves into the Cocoa Commodity Market Analysis through Elliott Wave Theory, Focusing on the Current Corrective Phase

This article delves into the cocoa market analysis through Elliott Wave Theory, focusing on the curr...

Read More >
In-Depth Bitcoin Analysis: BTCUSD Elliott Wave Insights, Trading Strategies, and Price Predictions for Market Success

In-Depth Bitcoin Analysis: BTCUSD Elliott Wave Insights, Trading Strategies, and Price Predictions for Market Success

Bitcoin (BTCUSD) analysis using the Elliott Wave framework to guide covers Wave C's corrective p...

Read More >
Mahindra & Mahindra Stock Analysis: Elliott Wave Forecast Reveals Bullish Trend, Critical Support Levels, and Upcoming Price Movements

Mahindra & Mahindra Stock Analysis: Elliott Wave Forecast Reveals Bullish Trend, Critical Support Levels, and Upcoming Price Movements

Mahindra & Mahindra stock analysis uses Elliott Wave patterns to forecast bullish trends, key suppor...

Read More >
VeChain Elliott Wave Analysis Signals Possible Wave III Breakout from Support: VETUSD Trading Strategy for Crypto Traders

VeChain Elliott Wave Analysis Signals Possible Wave III Breakout from Support: VETUSD Trading Strategy for Crypto Traders

The VETUSD pair is nearing the end of Wave II in a corrective structure. A bounce from the 0.020–0....

Read More >

$1 for 2 Weeks

then $29 a month!

What a Special Offer!

Trade Recommendations

Unleash the power of deversified trading with our comprehensive portfolio, covering 250+ markets:

  • Stock Trades
  • Crypto Trades
  • Forex Trades
  • Commodity Trades
Elliott Wave Analysis

Gain a competitive edge with expert insights and AI-powered Elliott Wave charting into:

  • Global Indices
  • US Stocks & ASX Stocks
  • Forex & Crypto
  • Commodities
Top-Notch Trading Tools

Equip yourself with the tools of success:

  • Real-time Chat rooms
  • Elliott Wave Algorithm
  • Portfolio tools
  • TradingLevels
  • Screener
  • Trading Game
7 Elliott Wave Analysts

Stay ahead of the market with daily charts and insightful videos
Your secret to strategic trading!

JOIN HERE


Welcome to TradingLounge (ASIC A.R.No. 321187), specialists in trades, trading education and technical analysis, covering stocks, indices, commodities, forex and cryptocurrencies.

When you join TradingLounge you have access to everything we offer, including trade tools, educational content and a social platform to chat with like-minded investors.

Read more

@Copyright 2024 by tradinglounge.com

Contact Us

Australian no: 02 4787 6020

International no: +61 (2) 47876020

Pay with:

Find us on