Elliott Wave Analysis for Netflix Inc. (NFLX) - September 10, 2024

Welcome to our latest Elliott Wave analysis for Netflix Inc. (NFLX) as of September 10, 2024. This detailed analysis explores NFLX's price movements through the lens of Elliott Wave Theory, offering valuable insights for traders seeking to capitalize on potential opportunities based on the current market structure and trend developments. In this article, we review both the daily and 1-hour charts to provide a comprehensive understanding of NFLX’s price action.

NFLX Elliott Wave Analysis - TradingLounge Daily Chart

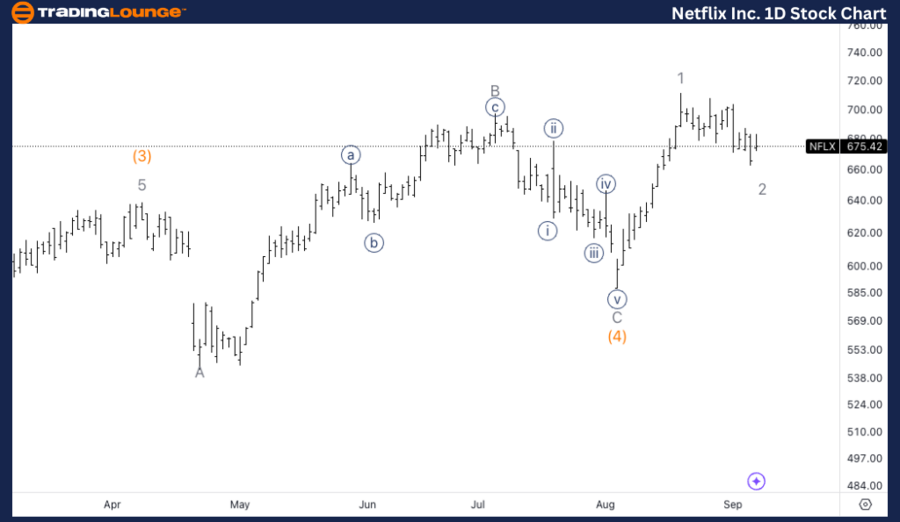
Netflix Inc. (NFLX) Daily Chart Analysis

NFLX Elliott Wave Technical Analysis

Function: Trend

Mode: Impulsive

Structure: Motive

Position: Wave 3

Direction: Upside in wave 3

Details: Anticipating upside movement into Minor wave 3 of Intermediate wave (5), with support holding above the $675 level, corresponding to the previous all-time high (ATH).

NFLX Stock Technical Analysis – Daily Chart

On the daily chart, Netflix is in a strong upward trend, driven by a Motive Wave structure. The stock is advancing within Minor wave 3 of the larger Intermediate wave (5), indicating a bullish market. Support around $675, which aligns with the previous ATH, is holding, reinforcing the potential for further upside in this wave 3 scenario.

Netflix-Inc-1D-Stock...


NFLX Elliott Wave Analysis - TradingLounge 1H Chart

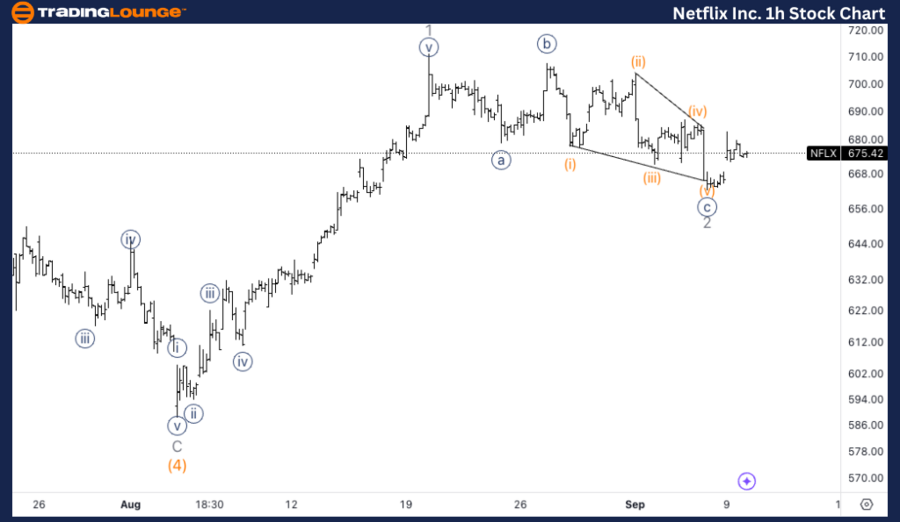
Netflix Inc. (NFLX) 1H Chart Analysis

NFLX Elliott Wave Technical Analysis

Function: Trend

Mode: Impulsive

Structure: Motive

Position: Wave {i} of 3

Direction: Upside in wave 3

Details: Expecting a three-wave corrective move in wave 2 to complete soon, with support tested around $680, which will boost confidence in further upward movement.

NFLX Elliott Wave Technical Analysis – 1H Chart

In the 1-hour chart, NFLX is in the early stages of an impulsive rally, moving within wave {i} of 3. The chart indicates that wave 2, a corrective phase, is nearing completion. A three-wave corrective move has occurred, and the price has tested key support at $680. If this level holds, it strengthens the case for further upside momentum, increasing confidence in the bullish outlook.

Technical Analyst: Alessio Barretta

Source: visit Tradinglounge.com and learn From the Experts Join TradingLounge Here 

See Previous: NVIDIA Corp. (NVDA) Elliott Wave Technical Analysis

Special Trial Offer - 0.76 Cents a Day for 3 Months! Click here

Access 7 Analysts Over 200 Markets Covered. Chat Room With Support

Netflix-Inc-1h-Stock...

Related

Elliott Wave Analysis for INSURANCE AUSTRALIA GROUP LIMITED (IAG) –  Technical Outlook, Wave Structure, Price Target & Market Trends

Elliott Wave Analysis for INSURANCE AUSTRALIA GROUP LIMITED (IAG) – Technical Outlook, Wave Structure, Price Target & Market Trends

Elliott Wave analysis for ASX: IAG, outlining key market trends, wave structure, and price targets. ...

Read More >
Elliott Wave Trading Strategies for SP500, NASDAQ 100 & Leading Tech Stocks

Elliott Wave Trading Strategies for SP500, NASDAQ 100 & Leading Tech Stocks

Elliott Wave analysis shows major indices and leading tech stocks in corrective Wave (4), setting up...

Read More >
Stocks Bullish Trend: NASDAQ, AAPL, AMZN, NVDA, TSLA, GOOGL, META, NFLX, MSFT, Elliott Wave Analysis

Stocks Bullish Trend: NASDAQ, AAPL, AMZN, NVDA, TSLA, GOOGL, META, NFLX, MSFT, Elliott Wave Analysis

NASDAQ Stock Market Elliott Wave Analysis and Trading Strategies Our Elliott Wave analysis covers t...

Read More >
Day and 4-hour Chart for British Pound/U.S.Dollar (GBPUSD) Elliott Wave Technical Analysis

Day and 4-hour Chart for British Pound/U.S.Dollar (GBPUSD) Elliott Wave Technical Analysis

Our GBP/USD Elliott Wave Analysis for the 4-hour chart on 13 March 24 suggests an ongoing impulsive ...

Read More >
Looking to Capitalize on Short-term Pullbacks and Market Movements: NEO Crypto Price News and NEOUSD Elliott Wave Analysis

Looking to Capitalize on Short-term Pullbacks and Market Movements: NEO Crypto Price News and NEOUSD Elliott Wave Analysis

This article provides a detailed Elliott Wave Analysis for NEOUSD, covering daily and 4-hour charts....

Read More >
Elliott Wave Trading Strategies for SP500, NASDAQ 100 & Leading Tech Stocks

Elliott Wave Trading Strategies for SP500, NASDAQ 100 & Leading Tech Stocks

Major indices and tech stocks, including SP500, NASDAQ 100, Apple, Tesla, Amazon, and Bitcoin, are c...

Read More >

$1 for 2 Weeks

then $29 a month!

What a Special Offer!

Trade Recommendations

Unleash the power of deversified trading with our comprehensive portfolio, covering 250+ markets:

  • Stock Trades
  • Crypto Trades
  • Forex Trades
  • Commodity Trades
Elliott Wave Analysis

Gain a competitive edge with expert insights and AI-powered Elliott Wave charting into:

  • Global Indices
  • US Stocks & ASX Stocks
  • Forex & Crypto
  • Commodities
Top-Notch Trading Tools

Equip yourself with the tools of success:

  • Real-time Chat rooms
  • Elliott Wave Algorithm
  • Portfolio tools
  • TradingLevels
  • Screener
  • Trading Game
7 Elliott Wave Analysts

Stay ahead of the market with daily charts and insightful videos
Your secret to strategic trading!

JOIN HERE


Welcome to TradingLounge (ASIC A.R.No. 321187), specialists in trades, trading education and technical analysis, covering stocks, indices, commodities, forex and cryptocurrencies.

When you join TradingLounge you have access to everything we offer, including trade tools, educational content and a social platform to chat with like-minded investors.

Read more

@Copyright 2024 by tradinglounge.com

Contact Us

Australian no: 02 4787 6020

International no: +61 (2) 47876020

Pay with:

Find us on