Tesla Inc., Elliott Wave Technical Analysis
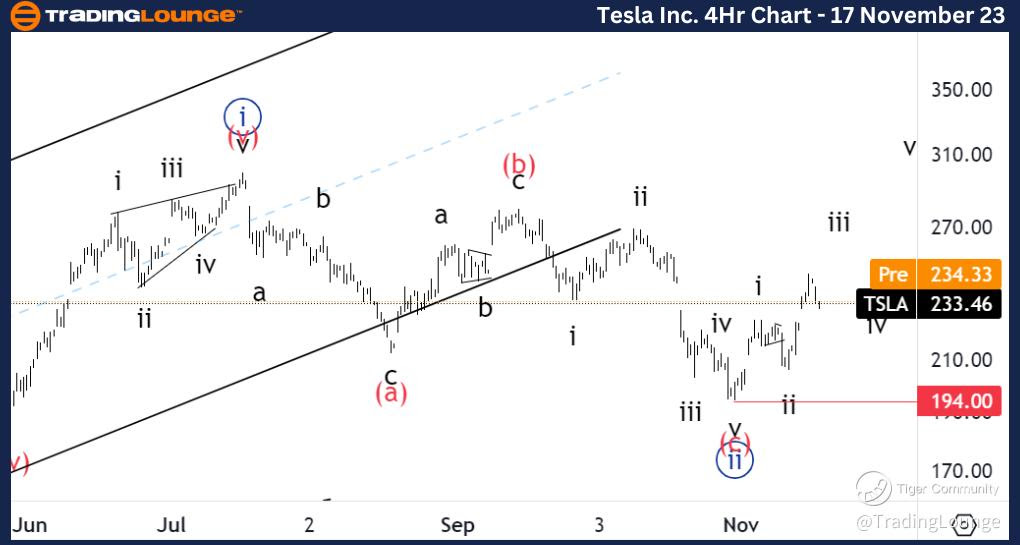
Tesla Inc., (TSLA:NASDAQ): 4h Chart 17 November 23
TSLA Stock Market Analysis: We have been monitoring Tesla for a potential bottom in place for a few weeks now. We could have found a turning point if we manage to confirm a five wave move to the upside into wave (i). Therefore we are looking for further upside to find support into a wave iv.
TSLA Elliott Wave Count: Wave iv of (i)
TSLA Technical Indicators: Support on 200EMA.
TSLA Trading Strategy: Looking for longs into wave v.
TradingLounge Analyst: Alessio Barretta
Source : Tradinglounge.com get trial here!

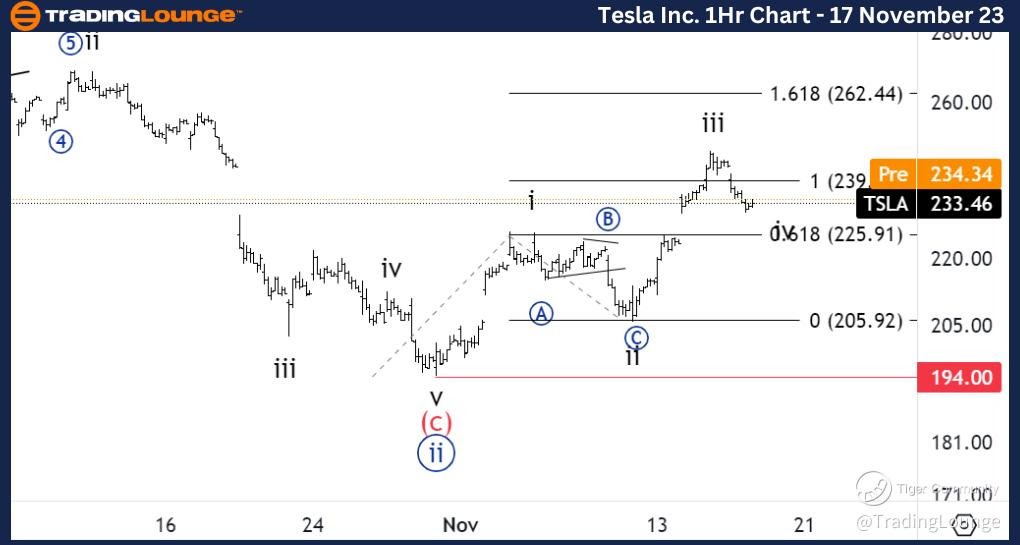
Tesla Inc., TSLA: 1-hour Chart 17 November 23
Tesla Inc., Elliott Wave Technical Analysis TSLA Stock Market Analysis: Looking for 235$ to hold as support to then confirm continuation higher into wave v. We could also be in a wave 1 of iii which would then open the possibility to a much larger upward move.
TSLA Elliott Wave count: Wave A of iv.
TSLA Technical Indicators: Support on the 20EMA
TSLA Trading Strategy: Looking for longs into wave v.
