Elliott Wave Analysis of Netflix (NFLX): The Current Trend and Its Implications
Netflix Inc. (NFLX) presents a compelling study when analyzed through the lens of Elliott Wave theory. As a powerful tool for understanding market trends and predicting future price movements, Elliott Wave analysis offers a unique perspective on NFLX's stock performance. In this article, we delve into a detailed Elliott Wave Technical Analysis of Netflix, focusing on its daily and 4-hour charts to provide investors with insights into its future trajectory.
Netflix Inc., (NFLX) Daily Chart Analysis: A Deep Dive into Netflix's Bullish Momentum
NFLX Elliott Wave Technical Analysis
FUNCTION: Trend
MODE: Impulsive
STRUCTURE: Motive
POSITION: Wave 3 of (3).
DIRECTION: Upside in wave 3.
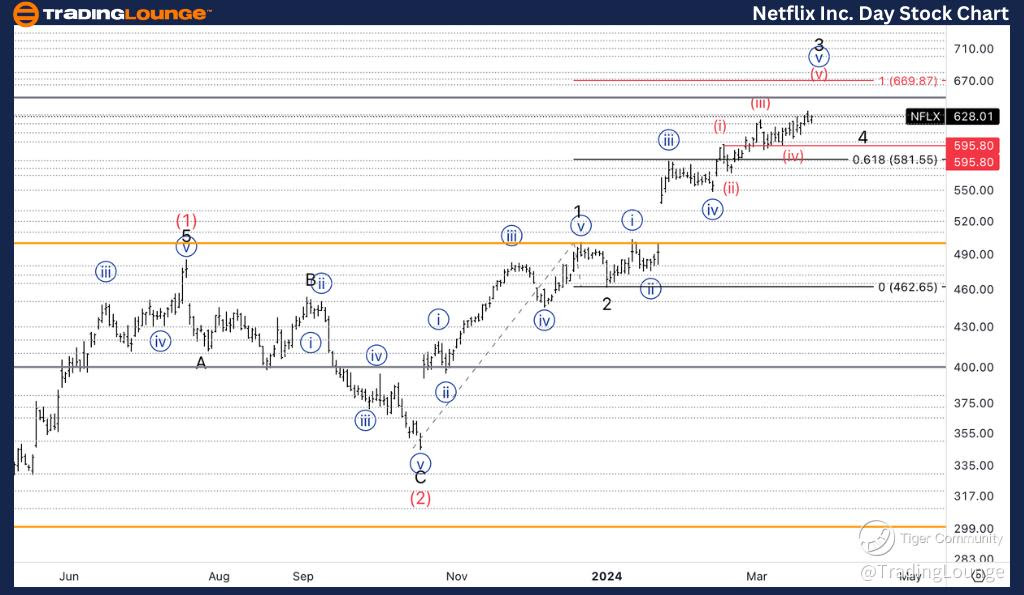
At the heart of our analysis is the identification of Netflix's stock as being in a strong uptrend, characterized by an impulsive wave pattern. Specifically, we find ourselves amid Wave 3 of (3), a critical juncture that suggests a continued upward momentum. This phase is inherently bullish, indicative of strong market sentiment and investor confidence in Netflix's growth prospects.
DETAILS: Price Projections and Key Levels to Watch
As we navigate through this bullish phase, our analysis suggests that Netflix is approaching a significant medium level at $650, a price point that could potentially mark the top of Wave 3. Furthermore, an interesting development arises when we consider the equality of Wave 3 versus Wave 1, pinpointing a target area around $670. These levels are crucial for investors to monitor, as they could signal pivotal moments in Netflix's price trajectory, offering opportunities for strategic decision-making.

Netflix Inc., (NFLX) 4-Hour Chart Insights: Understanding Short-Term Movements
Elliott Wave Positioning: Navigating Through the Waves
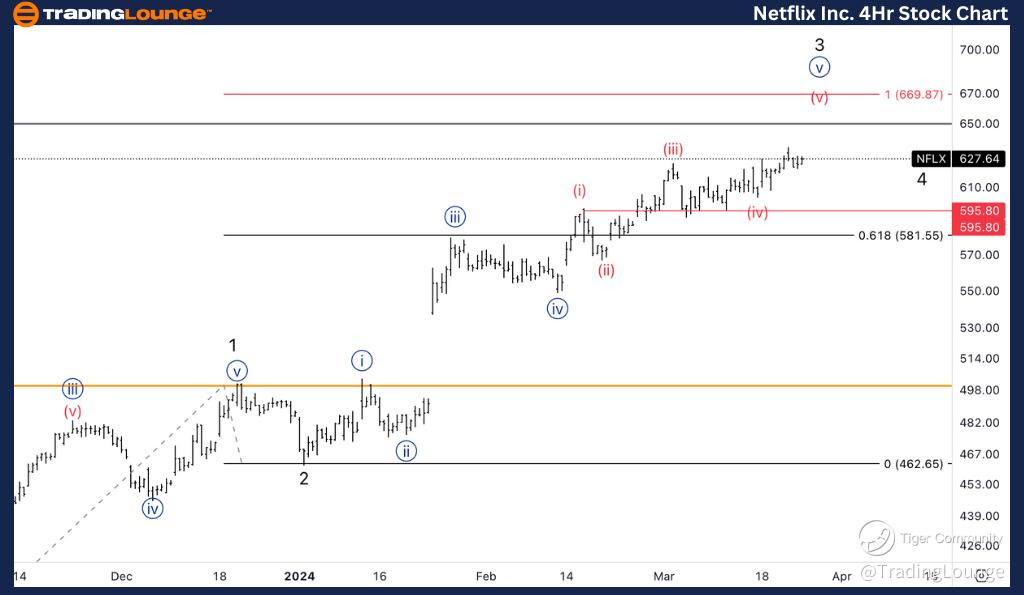
Shifting our focus to the 4-hour chart, we observe Netflix's stock in the final stages of its current bullish cycle, positioned in Wave (v) of {iii}. This positioning is significant as it indicates an ongoing upside momentum, with the stock poised for further gains in the short term.
The Role of Consolidation and Its Impact
A key aspect of our analysis is the recognition of a consolidation phase, identified as Wave (iv), which precedes the current upward movement. This consolidation is a natural part of the Elliott Wave cycle, allowing the stock to gather strength before resuming its upward trajectory. Investors should view these consolidation periods as potential opportunities to enter the market before the next leg up.
Conclusion: Strategic Insights for Investors
Our comprehensive Elliott Wave analysis of Netflix Inc. (NFLX) underscores a bullish outlook, with the stock demonstrating strong upward momentum on both daily and 4-hour charts. As we approach critical price levels, investors are encouraged to monitor these developments closely. The key to capitalizing on Elliott Wave analysis lies in understanding the cyclical nature of market movements and leveraging this knowledge to make informed investment decisions.
Understanding the Implications of Elliott Wave Analysis for NFLX
Elliott Wave theory provides a framework for predicting future price movements based on past patterns. For Netflix, the current analysis indicates a strong bullish trend that could offer lucrative opportunities for investors. By staying informed and strategically positioning their portfolios, investors can potentially reap the benefits of Netflix's dynamic market performance.
Technical Analyst: Alessio Barretta
Source: visit Tradinglounge.com and learn From the Experts Join TradingLounge Here
See Previous: The Coca-Cola Company, (KO)
TradingLounge Once Off SPECIAL DEAL: Here > 1 month Get 3 months.
