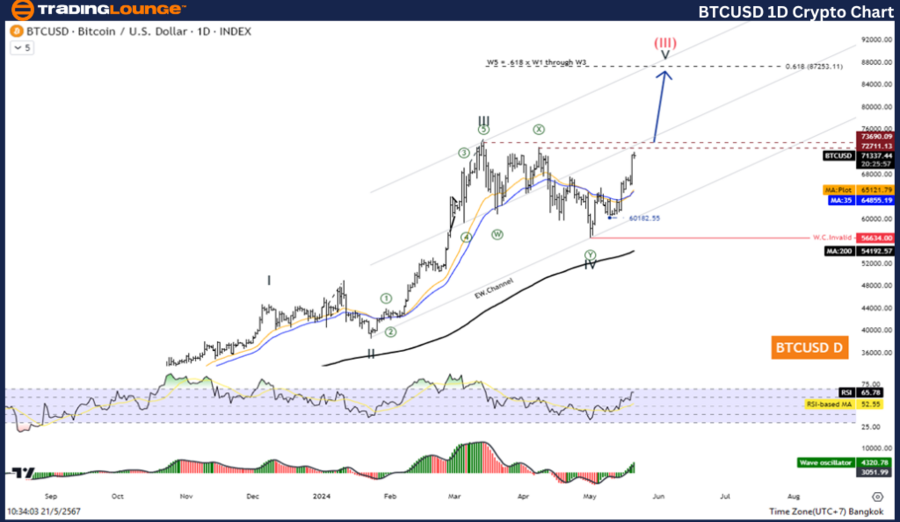
BTCUSD Elliott Wave Analysis TradingLounge Daily Chart
Bitcoin/ U.S. Dollar (BTCUSD) Crypto Chart
BTCUSD Elliott Wave Technical Analysis
Function: Follow Trend
Mode: Motive
Structure: Impulse
Position: Wave V
Direction Next Higher Degrees: Wave (III)
Wave Cancel Invalid Level: 31046.25
Details: Wave IV may be complete, and the price could increase again in Wave V.
Bitcoin/ U.S. Dollar (BTCUSD) Trading Strategy:
Overall, Bitcoin remains in an uptrend. The current period reflects a correction in the fourth wave, which seems to be complete. Therefore, this presents an opportunity to rejoin the trend. Look for chances to open long positions.
Bitcoin/ U.S. Dollar (BTCUSD) Technical Indicators:
- The price is above the MA200, indicating an uptrend.
- The Wave Oscillator shows bullish momentum.
On the daily chart, Bitcoin is exhibiting an impulse wave pattern, currently in Wave V. This suggests a continuation of the uptrend, following the completion of Wave IV. The price action is supportive of this analysis, as Bitcoin is trading above the 200-day moving average (MA200), a classic indicator of bullish momentum.

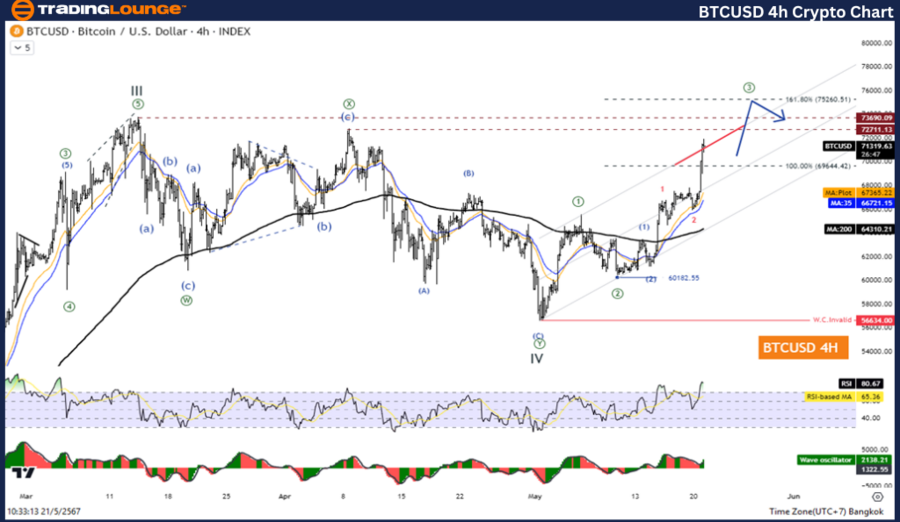
BTCUSD Elliott Wave Analysis TradingLounge H4 Chart
Bitcoin/ U.S. Dollar (BTCUSD) Crypto Analysis
BTCUSD Elliott Wave Technical Analysis
Function: Follow Trend
Mode: Motive
Structure: Impulse
Position: Wave V
Direction Next Higher Degrees: Wave (III)
Wave Cancel Invalid Level: 31046.25
Details: Wave IV may be complete, and the price could increase again in Wave V.
Bitcoin/ U.S. Dollar (BTCUSD) Trading Strategy:
Overall, Bitcoin remains in an uptrend. The current period reflects a correction in the fourth wave, which seems to be complete. Therefore, this presents an opportunity to rejoin the trend. Look for chances to open long positions.
Bitcoin/ U.S. Dollar (BTCUSD) Technical Indicators:
- The price is above the MA200, indicating an uptrend.
- The Wave Oscillator shows bullish momentum.
The H4 chart analysis corroborates the findings on the daily chart, with Bitcoin in Wave V of an impulse wave. Similar to the daily chart, the H4 chart's price action suggests the completion of Wave IV and the onset of Wave V.
Technical Analyst: Kittiampon Somboonsod
Source: visit Tradinglounge.com and learn From the Experts Join TradingLounge Here
See Previous: Bitcoin/ U.S. Dollar (BTCUSD) Elliott Wave Technical Analysis
Special Trial Offer - 0.76 Cents a Day for 3 Months! Click here
Access 7 Analysts Over 170 Markets Covered. Chat Room With Support
