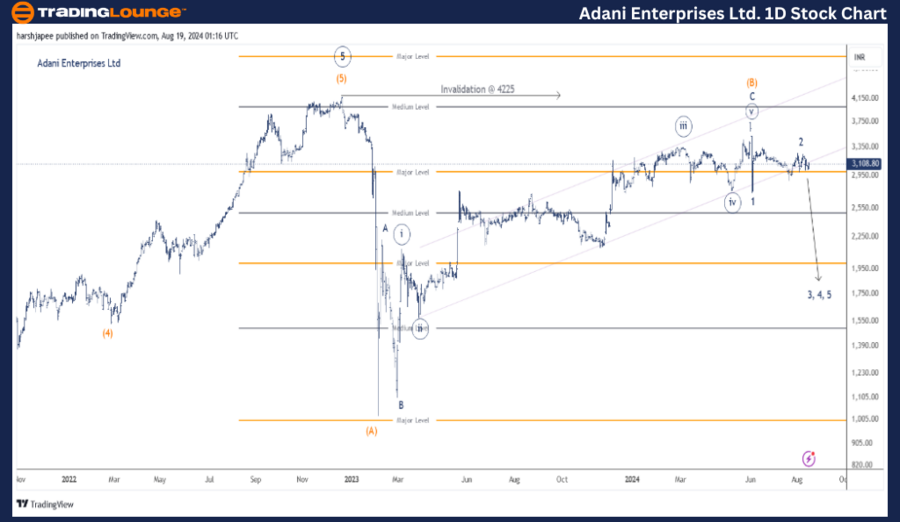
ADANI ENTERPRISES LTD – ADANIENT Elliott Wave Analysis TradingLounge (1D Chart)
ADANI ENTERPRISES Stocks Day Chart Analysis
ADANI ENTERPRISES Stocks – ADANIENT Elliott Wave Technical Analysis
Function: Counter Trend (Intermediate Degree, Orange)
Mode: Corrective
Structure: Flat (3-3-5)
Position: Minor Wave 2 Grey within Wave (C) Orange
Details: The larger degree impulse Wave ((5)) appears to have completed. The stock is likely undergoing a corrective phase in the form of a flat structure. Wave (A) and (B) seem to be complete, with Wave (C) potentially in progress. Additionally, Minor Waves 1 and 2 Grey also look finished. If this analysis is correct, Wave 3 should be unfolding lower from this point.
Invalidation Point: 4230-40
Adani Enterprises Daily Chart Technical Analysis and Potential Elliott Wave Counts
The Adani Enterprises Daily chart suggests that the larger degree uptrend may have completed around the 4225 level or is close to completion. The stock has been marked with the completion of Primary Wave ((5)) near 4225. Subsequently, an intermediate corrective Wave (A)-(B)-(C) could be developing against the 4225 level.
The stock peaked in December 2023 at 4225, followed by a sharp decline to the 1019 level, which potentially marks the completion of Intermediate Wave (A) of the larger correction. Wave (B) has unfolded as a flat (3-3-5) and appears complete around the 3750-80 level in June 2024.
If the above wave counts are accurate, the stock may be heading lower as Intermediate Wave (C) begins to unfold. Alternatively, if prices push higher through the 3750 level, it could indicate that Intermediate Wave (5) is still developing and may exceed the 4225 level.
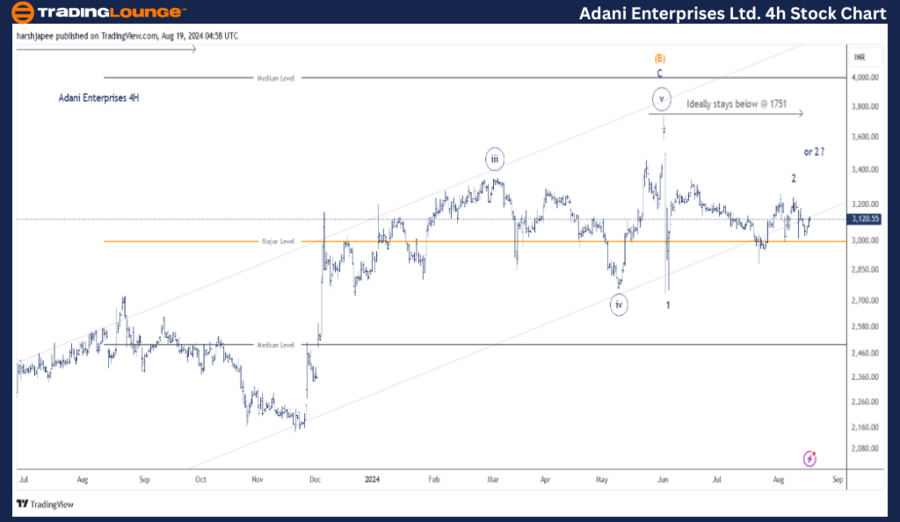
ADANI ENTERPRISES LTD – ADANIENT Elliott Wave Analysis TradingLounge (4h Chart)
ADANI ENTERPRISES Stocks Technical Analysis
Adani Enterprises 4H Chart Technical Analysis and Potential Elliott Wave Counts
The Adani Enterprises 4H chart highlights price action in the 3750-80 zone, indicating the potential termination of Wave (B) and subsequent developments. The stock is currently trading around the 3121 level at the time of writing, just below Minor Wave 2. If this analysis is correct, prices should turn sharply lower as Wave 3 begins to unfold.
The stock has rallied over the past 15 months, unfolding Intermediate Wave (B) around the 3750 level. The structure has developed as a flat, with Wave C unfolding as an impulse. Furthermore, prices dropped through the 2775 level on June 4th, marked as Minor Wave 1 in this analysis.
Minor Wave 2 potentially unfolded as a contracting triangle, terminating around the 3240-50 zone. If this holds true, prices would ideally remain below the 3240-50 level and turn lower as Wave 3 begins to unfold. Alternatively, the drop through 2775 could be Minute Wave ((iv)), with Wave ((v)) progressing higher.
Conclusion:
Adani Enterprises is potentially set for a larger degree (Intermediate) corrective Wave (A)-(B)-(C) Orange, against the 4225 level broadly.
Technical Analyst: Harsh Japee
Source: visit Tradinglounge.com and learn From the Experts Join TradingLounge Here
Previous: MARUTI SUZUKI INDIA – MARUTI Elliott Wave Analysis
Special Trial Offer - 0.76 Cents a Day for 3 Months! Click here
Access 7 Analysts Over 170 Markets Covered. Chat Room With Support