21Mar

Bovespa Index Elliott Wave Analysis: Daily and Weekly Technical Forecast with Bullish Trend, Impulsive Waves, and Market Outlook

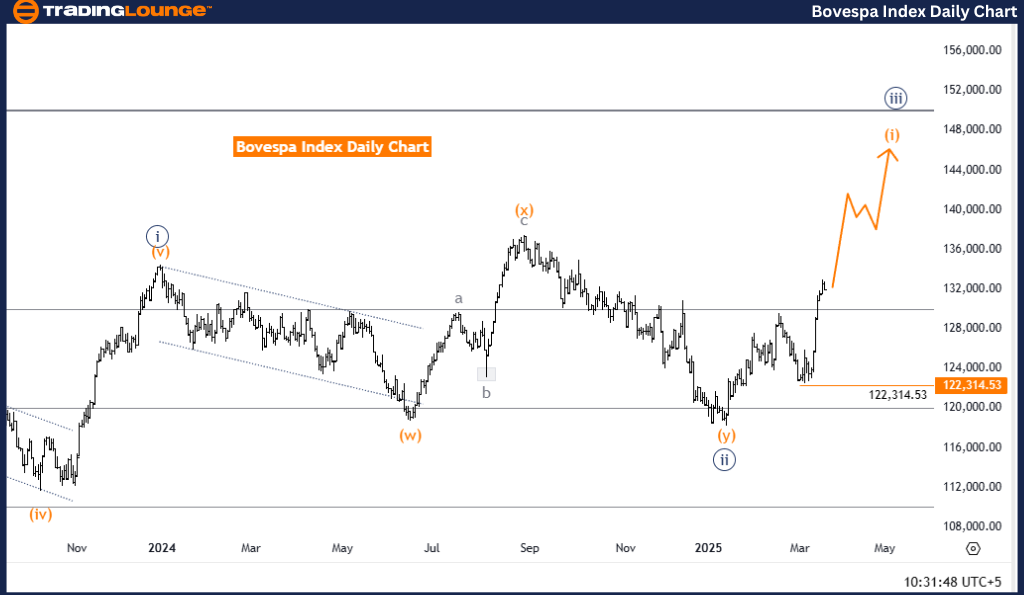
Bovespa Index Elliott Wave Analysis – TradingLounge Daily Chart

Bovespa Index Elliott Wave Technical Analysis

Function: Bullish Trend

Mode: Impulsive

Structure: Orange Wave 1

Position: Navy Blue Wave 3

Next Lower Degree Direction: Orange Wave 2

Wave Invalidation Level: 122,314.53

Details:

This Elliott Wave daily chart analysis of the Bovespa Index identifies a strong bullish trend characterized by impulsive wave behavior. The current wave count positions Orange Wave 1 within the broader Navy Blue Wave 3, signaling sustained upward movement within the larger trend.

The chart suggests Navy Blue Wave 2 has ended, allowing Orange Wave 1 of 3 to progress. As part of an impulsive sequence, this wave indicates potential for continued gains until Orange Wave 2 begins to form.

One of the most critical price markers is the wave invalidation level at 122,314.53. A price drop beneath this threshold would negate the current wave count, necessitating a revised outlook on market direction.

Trading Outlook:

Traders are advised to monitor Orange Wave 1's progression and prepare for the emergence of Orange Wave 2. Spotting these wave transitions early is essential for optimizing entry and exit strategies in harmony with the current trend.

This daily analysis enhances short- to medium-term trading setups by clarifying wave positions. A firm understanding of wave sequencing and adherence to invalidation points ensures traders can respond effectively to price changes.

bovespa-1d-index-cha...


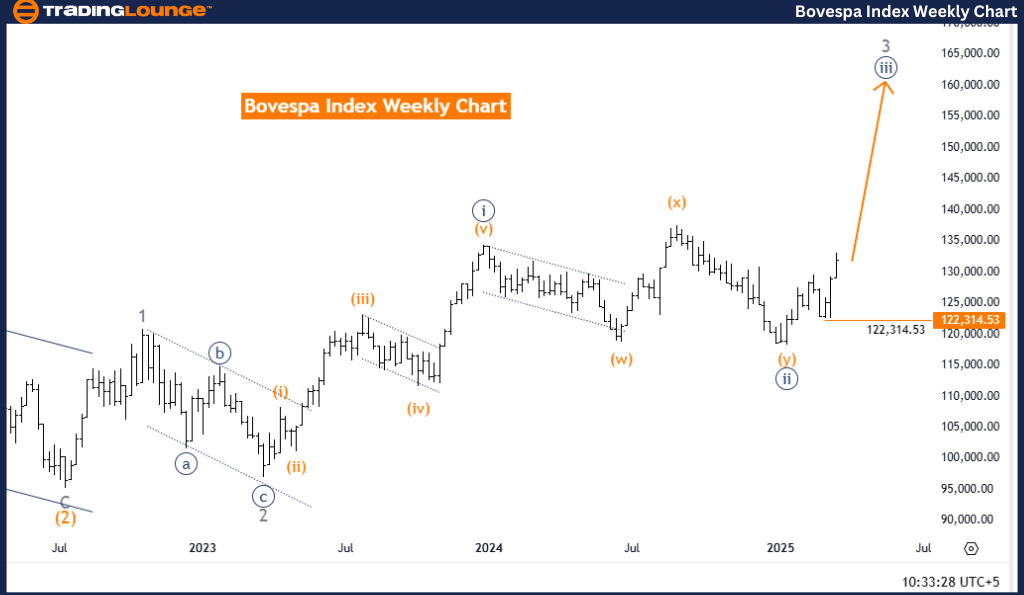
Bovespa Index Elliott Wave Analysis – TradingLounge Weekly Chart

Bovespa Index Elliott Wave Technical Analysis

Function: Bullish Trend

Mode: Impulsive

Structure: Navy Blue Wave 3

Position: Gray Wave 3

Next Lower Degree Direction: Navy Blue Wave 4 (In Progress)

Wave Invalidation Level: 122,314.53

Details:

This weekly Elliott Wave forecast for the Bovespa Index highlights a long-term bullish trajectory defined by impulsive wave formations. The key structure under focus is Navy Blue Wave 3, nested within the larger Gray Wave 3 phase.

Evidence suggests Navy Blue Wave 2 has finalized, making way for a strong and directional Navy Blue Wave 3, which is now underway. This movement is expected to continue upward until Navy Blue Wave 4 starts to take shape—which the current chart indicates has begun.

If the index retreats below 122,314.53, the wave count would be invalidated, implying a potential deviation from the expected bullish path.

Trading Outlook:

Market analysts should focus on the evolution of Navy Blue Wave 3 and anticipate developments in Navy Blue Wave 4. Accurate placement of wave positions is crucial to maintaining an informed trading perspective.

This weekly chart analysis provides a broader view for swing and position traders, helping to align strategies with prevailing macro trends. Recognizing the hierarchy of wave structures and monitoring invalidation points can enhance both decision-making and risk control.

Technical Analyst: Malik Awais

Source: Visit Tradinglounge.com and learn from the Experts. Join TradingLounge Here 

Previous: CAC 40 (France) Elliott Wave Technical Analysis

VALUE Offer - Buy 1 Month & Get 3 Months!Click here

Access 7 Analysts Over 200 Markets Covered. Chat Room With Support

bovespa-weekly-index...

Related

KOSPI Composite Index Elliott Wave Technical Analysis shows Bullish Trend Currently on both Daily and Weekly Charts

KOSPI Composite Index Elliott Wave Technical Analysis shows Bullish Trend Currently on both Daily and Weekly Charts

The KOSPI Composite is currently in a bullish trend, supported by Elliott Wave analysis on both dail...

Read More >
Natural Gas Elliott Wave Technical Analysis 12 February 24 Market Trends, Trading Strategies

Natural Gas Elliott Wave Technical Analysis 12 February 24 Market Trends, Trading Strategies

In this comprehensive Natural Gas Elliott Wave Analysis for February 12, traders gain valuable insig...

Read More >
NIFTY 50 Index Elliott Wave Technical Analysis Reveals Bullish Impulsive Trend with Strong Market Forecast and Support Level at 1621

NIFTY 50 Index Elliott Wave Technical Analysis Reveals Bullish Impulsive Trend with Strong Market Forecast and Support Level at 1621

The Nifty 50 Index shows a strong bullish impulsive trend on daily and weekly charts. Elliott Wave s...

Read More >
Elliott Wave Analysis for Asian Paints Stock: Price Predictions and Forecast with Insights into the Stock's Possible Trajectory

Elliott Wave Analysis for Asian Paints Stock: Price Predictions and Forecast with Insights into the Stock's Possible Trajectory

This article provides an in-depth Elliott Wave analysis for Asian Paints stock, including key techni...

Read More >
Gold XAUUSD Commodity Elliott Wave Analysis: Explore the Current Price Trends, Wave Structures, and Future Projections

Gold XAUUSD Commodity Elliott Wave Analysis: Explore the Current Price Trends, Wave Structures, and Future Projections

In this comprehensive Gold Elliott Wave Analysis, we explore the current price trends, wave structur...

Read More >
Understand How the Elliott Wave Structure is Shaping Dogecoin's Future Movements: DOGEUSD Technical Analysis

Understand How the Elliott Wave Structure is Shaping Dogecoin's Future Movements: DOGEUSD Technical Analysis

This article provides a comprehensive Elliott Wave analysis for Dogecoin (DOGEUSD), including a deta...

Read More >

$1 for 2 Weeks

then $29 a month!

What a Special Offer!

Trade Recommendations

Unleash the power of deversified trading with our comprehensive portfolio, covering 250+ markets:

  • Stock Trades
  • Crypto Trades
  • Forex Trades
  • Commodity Trades
Elliott Wave Analysis

Gain a competitive edge with expert insights and AI-powered Elliott Wave charting into:

  • Global Indices
  • US Stocks & ASX Stocks
  • Forex & Crypto
  • Commodities
Top-Notch Trading Tools

Equip yourself with the tools of success:

  • Real-time Chat rooms
  • Elliott Wave Algorithm
  • Portfolio tools
  • TradingLevels
  • Screener
  • Trading Game
7 Elliott Wave Analysts

Stay ahead of the market with daily charts and insightful videos
Your secret to strategic trading!

JOIN HERE


Welcome to TradingLounge (ASIC A.R.No. 321187), specialists in trades, trading education and technical analysis, covering stocks, indices, commodities, forex and cryptocurrencies.

When you join TradingLounge you have access to everything we offer, including trade tools, educational content and a social platform to chat with like-minded investors.

Read more

@Copyright 2024 by tradinglounge.com

Contact Us

Australian no: 02 4787 6020

International no: +61 (2) 47876020

Pay with:

Find us on