20Mar

CAC 40 Elliott Wave Analysis: Bullish Trend, Market Forecast, and Technical Insights for Investors

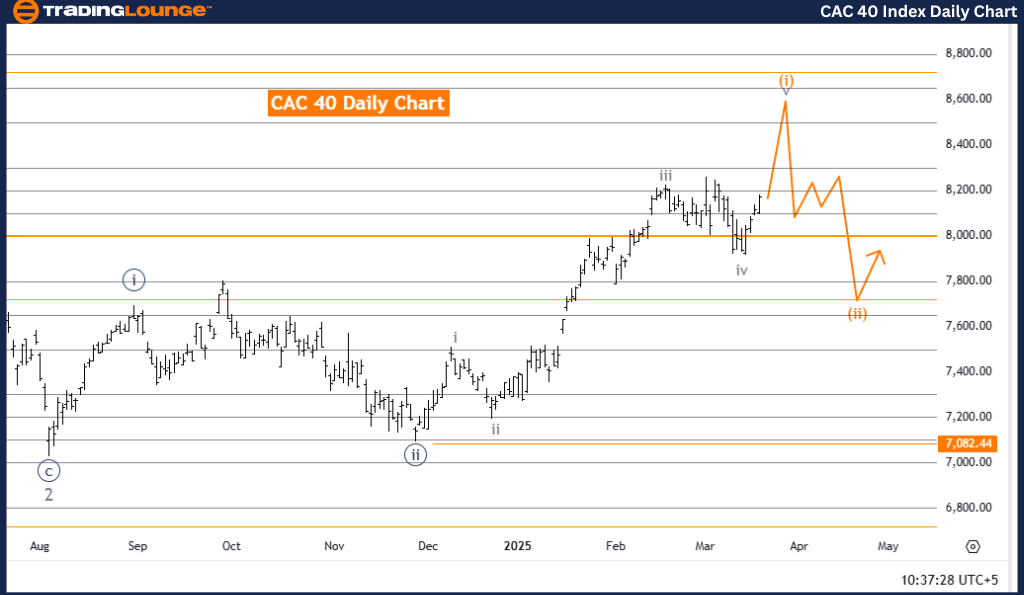
CAC 40 (France) Elliott Wave Analysis – Trading Lounge Daily Chart

CAC 40 (France) Wave Technical Analysis

Function: Bullish Trend

Mode: Impulsive

Structure: Gray Wave 5

Position: Orange Wave 1

Next Lower Degree Direction: Orange Wave 2

Wave Cancellation Level: 7,082.44

Analysis Details:

The CAC 40 Elliott Wave Analysis on the daily chart confirms a bullish trend, with the market currently in an impulsive phase, signaling strong upward momentum.

  • The primary wave structure under focus is Gray Wave 5, forming part of a larger Elliott Wave cycle.
  • Gray Wave 5 is positioned within Orange Wave 1, confirming its placement in the broader Elliott Wave framework.
  • The previous corrective phase (Gray Wave 4) appears completed, allowing the market to shift into Gray Wave 5 of Orange Wave 1.
  • As Wave 5 is usually the final phase in an impulsive sequence, further market gains may occur before a possible correction into Orange Wave 2.
  • A critical invalidation point is 7,082.44—if the price moves below this level, the current wave structure becomes invalid, prompting traders to reevaluate their strategies.

Trading Considerations:

  • Traders should monitor key price levels and anticipate potential market corrections post-Gray Wave 5 completion.
  • The bullish wave structure aligns with the broader Elliott Wave cycle, supporting continued market expansion.
  • Close observation of price movements and wave progressions enables traders to execute strategic trades based on the prevailing market conditions.

CAC-40-index-daily-c...


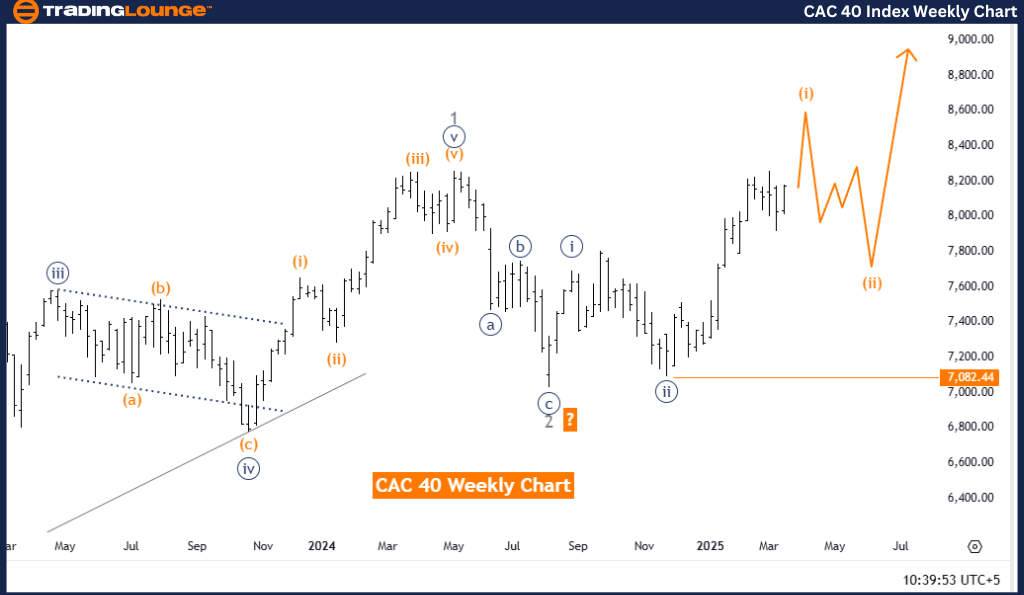
CAC 40 (France) Elliott Wave Analysis – Trading Lounge Weekly Chart

CAC 40 (France) Elliott Wave Technical Analysis

Function: Bullish Trend

Mode: Impulsive

Structure: Orange Wave 1

Position: Navy Blue Wave 3

Next Lower Degree Direction: Orange Wave 2

Wave Cancellation Level: 7,082.44

Analysis Details:

The CAC 40 Elliott Wave Analysis on the weekly chart confirms a bullish trend, with the market in an impulsive phase, reflecting strong upward momentum.

  • The primary wave structure under analysis is Orange Wave 1, which is part of a larger Elliott Wave cycle.
  • Orange Wave 1 is positioned within Navy Blue Wave 3, confirming its place in the broader Elliott Wave formation.
  • The previous corrective phase (Orange Wave 2) appears completed, allowing the market to transition into Orange Wave 1 of Wave 3.
  • Since Wave 3 often represents the strongest segment in an impulsive sequence, further market gains are anticipated before any major corrections.
  • A critical invalidation point is set at 7,082.44—if the price drops below this threshold, the current wave structure becomes invalid, requiring traders to adjust their trading plans.

Trading Considerations:

  • Traders should carefully monitor key price levels and prepare for potential market corrections after the completion of Orange Wave 1 of Wave 3.
  • The bullish wave structure aligns with the larger Elliott Wave trend, supporting continued market growth.
  • Tracking price movements and wave progressions helps traders to optimize trade execution based on current market dynamics.

Technical Analyst: Malik Awais

Source: Visit Tradinglounge.com and learn from the Experts. Join TradingLounge Here 

Previous: TASI Elliott Wave Technical Analysis

VALUE Offer - Buy 1 Month & Get 3 Months!Click here

Access 7 Analysts Over 200 Markets Covered. Chat Room With Support

CAC-40-index-weekly-...

Related

BTCUSD Elliott Wave Analysis: Master Bitcoin Price Trends, Trading Strategies, Corrective Waves, and Technical Indicators

BTCUSD Elliott Wave Analysis: Master Bitcoin Price Trends, Trading Strategies, Corrective Waves, and Technical Indicators

This article provides a thorough BTCUSD Elliott Wave analysis for Bitcoin, covering price trends, co...

Read More >
Unlock Bitcoin's Future: Master BTCUSD Trading with Elliott Wave  Analysis

Unlock Bitcoin's Future: Master BTCUSD Trading with Elliott Wave Analysis

This article provides a detailed Elliott Wave analysis of Bitcoin (BTCUSD), focusing on current mark...

Read More >
S&P BSE Sensex (India) Elliott Wave Analysis: Bullish Trend Forecast, Impulse Wave Patterns, Stock Market Outlook & Trading Strategy

S&P BSE Sensex (India) Elliott Wave Analysis: Bullish Trend Forecast, Impulse Wave Patterns, Stock Market Outlook & Trading Strategy

Elliott Wave forecast for the S&P BSE Sensex, covering both daily and weekly charts. It confirms a b...

Read More >
Elliott Wave Analysis for NASDAQ Tech Stocks and SP500: Navigating the Correction Phase

Elliott Wave Analysis for NASDAQ Tech Stocks and SP500: Navigating the Correction Phase

NASDAQ 100 (NDX) and SP500 (SPX) are currently in an intermediate or primary wave four, marking the ...

Read More >
Seizing Counter-Trend Opportunities: British Pound/ Australian Dollar(GBPAUD) Elliott Wave Technical Analysis Insights

Seizing Counter-Trend Opportunities: British Pound/ Australian Dollar(GBPAUD) Elliott Wave Technical Analysis Insights

Our British Pound/ Australian Dollar(GBPAUD) Elliott Wave Analysis, uncovers counter-trend potential...

Read More >
Elliott Wave Analysis: Uncover Trading Strategies on S&P 500, NASDAQ 100, DAX 40, FTSE 100 & ASX 200

Elliott Wave Analysis: Uncover Trading Strategies on S&P 500, NASDAQ 100, DAX 40, FTSE 100 & ASX 200

Our latest blog post delves into Elliott Wave analysis on major indices like the S&P 500, NASDAQ 100...

Read More >

Buy 1 Month

Get 3 Months!

Special Offer:

Trade Recommendations

Unleash the power of deversified trading with our comprehensive portfolio, covering:

  • Stock Trades
  • Crypto Trades
  • Forex Trades
  • Commodity Trades
Elliott Wave Analysis

Gain a competive edge with expert insights in to:

  • Global Indices
  • US Stocks & ASX Stocks
  • Forex & Crypto
  • Commodities
Top-Notch Trading Tools

Equip yourself with the tools of success:

  • Social Chat
  • Elliott Wave Algorithm
  • Screener
  • TradingLevels
  • Trading Game
7 Elliott Wave Analysts

Stay ahead of the market with daily charts and insightful videos
-Your secret to strategic trading!

JOIN HERE


Welcome to TradingLounge (ASIC A.R.No. 321187), specialists in trades, trading education and technical analysis, covering stocks, indices, commodities, forex and cryptocurrencies.

When you join TradingLounge you have access to everything we offer, including trade tools, educational content and a social platform to chat with like-minded investors.

Read more

@Copyright 2024 by tradinglounge.com

Contact Us

Australian no: 02 4787 6020

International no: +61 (2) 47876020

Pay with:

Find us on