15Mar

SGX TSI Iron Ore Commodity Elliott Wave Technical Analysis & Key Support Levels for Traders, Miners, and Steel Producers in 2025

SGX TSI Iron Ore Elliott Wave Analysis – March 2025 Update

Understanding SGX TSI Iron Ore Futures

SGX TSI Iron Ore futures, traded on the Singapore Exchange (SGX), serve as a benchmark for global iron ore pricing. This contract, based on The Steel Index (TSI), tracks iron ore spot prices and provides a vital tool for hedging and speculation in the iron ore market. Miners, steel producers, and traders use it extensively due to its cash-settled structure, which reflects the price of 62% Fe iron ore fines delivered to China.

Market Overview: Recovery After a Sharp Decline

Following a steep decline from February 20 to March 5, 2025, SGX TSI Iron Ore is witnessing a strong recovery. If the January 2024 lows remain intact, the upward momentum could extend into September 2024, pushing prices higher. However, if the corrective bounce peaks and exhausts, the larger trend favors a downside continuation—unless January 2024 highs are breached.

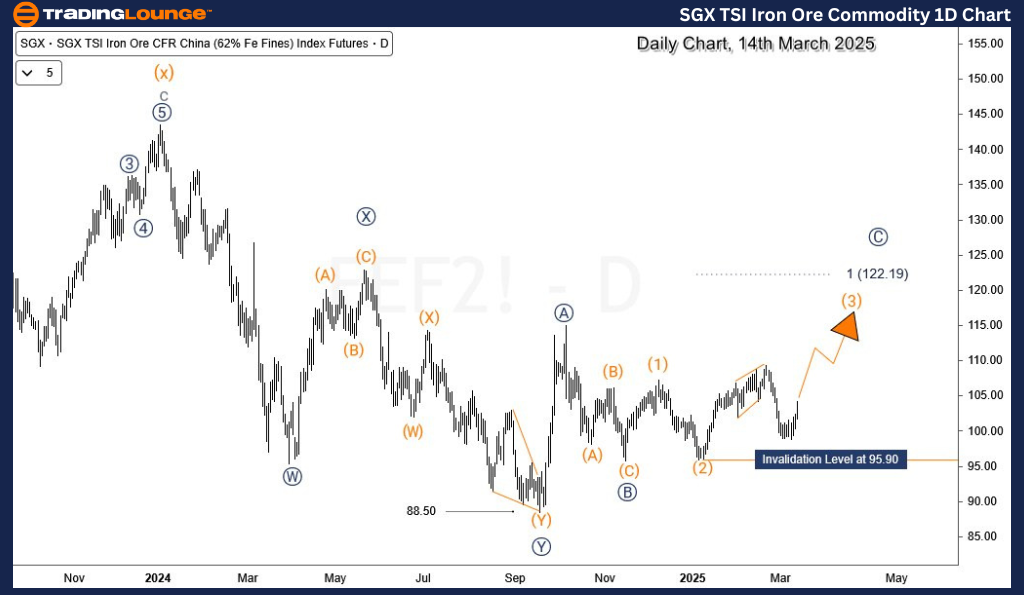
SGX TSI Iron Ore Daily Chart Analysis: Corrective Bounce Expected

A sideways and choppy price movement has defined SGX TSI Iron Ore since October 2024. The September 2024 low at 88.5 marked the end of the bearish cycle that started in January 2024. Now, the current bullish bounce is expected to correct the previous downtrend.

  • The first leg of this bullish correction concluded with an impulsive rally in October 2024, followed by a retracement.
  • The next phase projects a five-wave rally, potentially reaching 122.19.
  • Key short-term support: Prices must stay above 95.90 to maintain the bullish bias.

SGX-TSI-Iron-Ore-com...


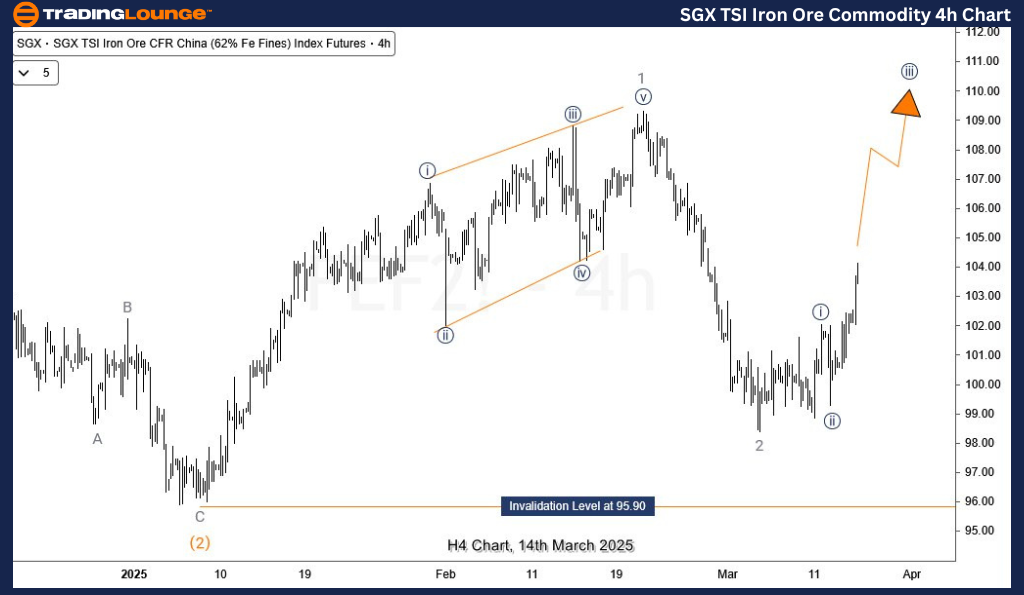
SGX TSI Iron Ore H4 Chart Analysis: Wave 3 in Motion

The H4 chart structure suggests that wave 3 of (3) is beginning to unfold. A rapid move upward toward the February 2025 highs would confirm this scenario. A strong push higher in this wave would reinforce the bullish outlook, supporting further price appreciation.

Key Takeaways for Traders

  • ✅ Bullish momentum remains intact as long as prices stay above 95.90.
  • ✅ Next upside target is 122.19 if the five-wave rally progresses.
  • ✅ Wave 3 acceleration will strengthen the bullish outlook in the short term.
  • ✅ Downside risk increases if January 2024 highs fail to break.

Traders should closely watch support and resistance levels to confirm the Elliott Wave structure and adjust positions accordingly.

Technical Analyst: Sanmi Adeagbo

Source: Visit Tradinglounge.com and learn from the Experts Join TradingLounge Here 

See Previous: Silver Elliott Wave Technical Analysis

VALUE Offer - Buy 1 Month & Get 3 Months!Click here

Access 7 Analysts Over 200 Markets Covered. Chat Room With Support

SGX-TSI-Iron-Ore-com...

Related

NEO/ U.S. dollar(NEOUSD) Elliott Wave Technical Analysis 6 December 23

NEO/ U.S. dollar(NEOUSD) Elliott Wave Technical Analysis 6 December 23

NEO/ U.S. dollar(NEOUSD) Elliott Wave Technical Analysis dated 6 December 23, offers an in-depth per...

Read More >
UNIBAIL RODAMCO WESTFIELD Stock Analysis & URW Elliott Wave Technical Forecast Make Informed Decisions

UNIBAIL RODAMCO WESTFIELD Stock Analysis & URW Elliott Wave Technical Forecast Make Informed Decisions

Our detailed Elliott Wave analysis of ASX: UNIBAIL-RODAMCO-WESTFIELD (URW) provides insights into cu...

Read More >
Exxon Mobil Inc. Stocks Elliott Wave Technical Analysis: Focusing XOM Stcok Market Behavior with chart Analysis

Exxon Mobil Inc. Stocks Elliott Wave Technical Analysis: Focusing XOM Stcok Market Behavior with chart Analysis

Discover our latest Elliott Wave analysis for Exxon Mobil Inc. (XOM) as of June 10, 2024. This compr...

Read More >
Meta Platforms Inc. Stocks Elliott Wave Technical Analysis - Charts show an ongoing Bullish Trend Highlighting key Resistance Levels

Meta Platforms Inc. Stocks Elliott Wave Technical Analysis - Charts show an ongoing Bullish Trend Highlighting key Resistance Levels

This analysis of Meta Platforms (META) provides a detailed Elliott Wave forecast, highlighting key r...

Read More >
Understand the key Signals and Patterns in Gold's Market Movement: Gold (XAUUSD) Commodity Elliott Wave Analysis

Understand the key Signals and Patterns in Gold's Market Movement: Gold (XAUUSD) Commodity Elliott Wave Analysis

This article provides a comprehensive Gold Elliott Wave analysis, covering gold price predictions, m...

Read More >
Natural Gas Commodity Elliott Technical Analysis: Strategic Trading Opportunities to help you Navigate the Market Effectively

Natural Gas Commodity Elliott Technical Analysis: Strategic Trading Opportunities to help you Navigate the Market Effectively

Explore our detailed natural gas technical analysis through Elliott Wave theory. Learn about the cur...

Read More >

Buy 1 Month

Get 3 Months!

Special Offer:

Trade Recommendations

Unleash the power of deversified trading with our comprehensive portfolio, covering:

  • Stock Trades
  • Crypto Trades
  • Forex Trades
  • Commodity Trades
Elliott Wave Analysis

Gain a competive edge with expert insights in to:

  • Global Indices
  • US Stocks & ASX Stocks
  • Forex & Crypto
  • Commodities
Top-Notch Trading Tools

Equip yourself with the tools of success:

  • Social Chat
  • Elliott Wave Algorithm
  • Screener
  • TradingLevels
  • Trading Game
7 Elliott Wave Analysts

Stay ahead of the market with daily charts and insightful videos
-Your secret to strategic trading!

JOIN HERE


Welcome to TradingLounge (ASIC A.R.No. 321187), specialists in trades, trading education and technical analysis, covering stocks, indices, commodities, forex and cryptocurrencies.

When you join TradingLounge you have access to everything we offer, including trade tools, educational content and a social platform to chat with like-minded investors.

Read more

@Copyright 2024 by tradinglounge.com

Contact Us

Australian no: 02 4787 6020

International no: +61 (2) 47876020

Pay with:

Find us on