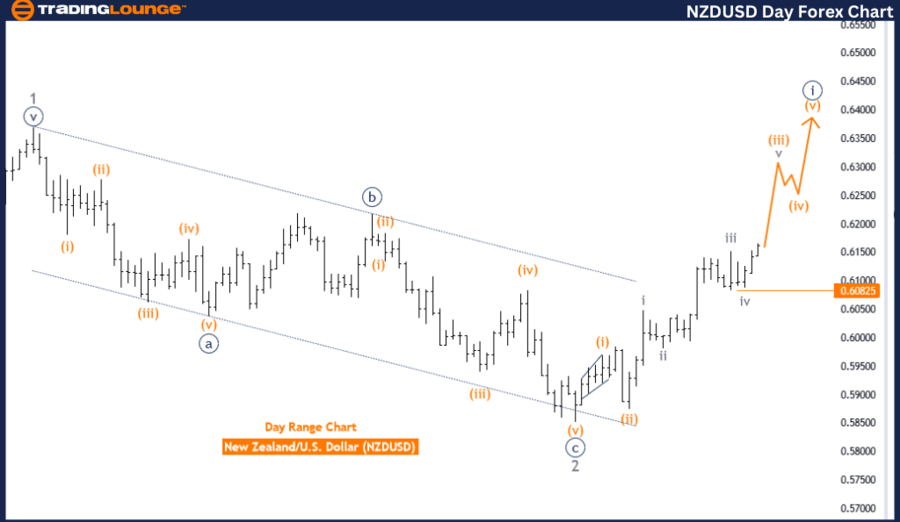
NZDUSD Elliott Wave Analysis Trading Lounge Day Chart,
New Zealand Dollar/U.S.Dollar (NZDUSD) Day Chart
NZDUSD Elliott Wave Technical Analysis
FUNCTION: Trend
MODE: impulsive
STRUCTURE: orange wave 3
POSITION: navy blue wave 1
DIRECTION NEXT LOWER DEGREES: orange wave 4
DETAILS orange wave 3 of 1 is in play and looking near to end.
Wave Cancel invalid level: 0.60865
The NZDUSD Elliott Wave Analysis on the daily chart is focused on identifying the current trend and projecting future movements based on the Elliott Wave Principle. This analysis highlights a trend that is impulsive in nature, characterized by a series of advancing waves that form the basis for future market predictions.
The primary wave structure under consideration is orange wave 3, which is positioned within navy blue wave 1. This indicates that the market is currently in the third wave of the first larger wave sequence, and this third wave is nearing its completion. The next anticipated movement is orange wave 4, a corrective phase that typically follows the completion of an impulsive wave.
The details of the analysis suggest that orange wave 3 of navy blue wave 1 is actively in play and approaching its end. This means that after the completion of this current impulsive wave, the market is expected to enter a corrective phase marked by orange wave 4. Such corrective waves are essential in the Elliott Wave Theory as they provide a necessary counter-movement to the preceding impulsive waves, helping to balance the overall wave structure.
An important aspect of this analysis is the invalidation level set at 0.60865. This level serves as a critical threshold; if the market price were to reach or drop below this point, it would invalidate the current wave count, necessitating a reassessment of the wave structure and potentially altering the projected market movements.
This invalidation level helps traders maintain a disciplined approach, ensuring they can adjust their strategies promptly if the market behaves contrary to the expected wave pattern.
In summary, the NZDUSD Elliott Wave Analysis on the daily chart provides a structured forecast of the market’s direction based on the principles of wave theory. With orange wave 3 of navy blue wave 1 nearing completion, traders should prepare for the ensuing corrective phase of orange wave 4. The analysis underscores the importance of monitoring the invalidation level at 0.60865, which serves as a key point for validating or reassessing the wave count. This detailed analysis aids traders in making informed decisions by anticipating future market trends and movements.

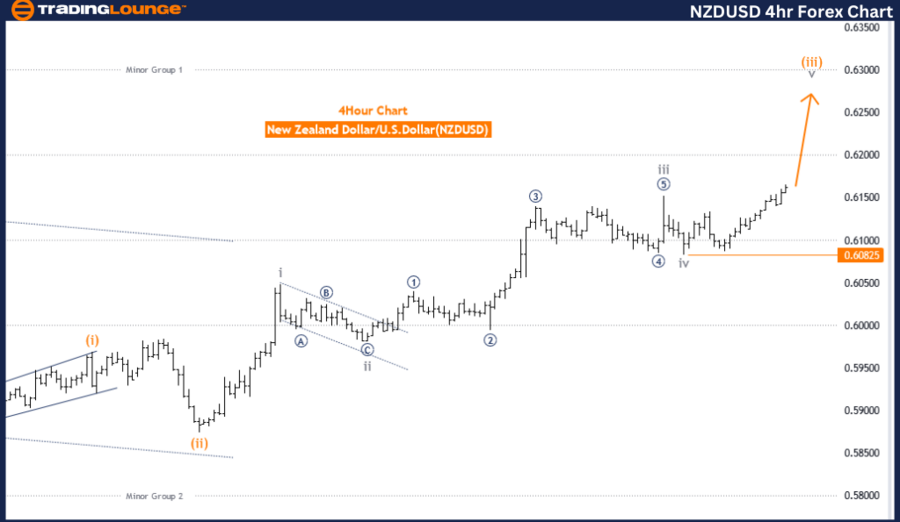
NZDUSD Elliott Wave Analysis Trading Lounge 4 Hour Chart,
New Zealand Dollar/U.S.Dollar(NZDUSD) 4 Hour Chart
NZDUSD Elliott Wave Technical Analysis
FUNCTION: Trend
MODE: impulsive
STRUCTURE: gray wave 5
POSITION: orange wave 3
DIRECTION NEXT LOWER DEGREES: orange wave 4
DETAILS gray wave 4 of 3 looking completed, now gray wave 5 of 3 is in play.
Wave Cancel invalid level: 0.60865
The NZDUSD Elliott Wave Analysis on the 4-hour chart highlights a trend that is characterized by an impulsive mode. The current wave structure being analyzed is gray wave 5, which is positioned within orange wave 3. Following this wave, the next anticipated movement is orange wave 4, indicating a potential upcoming corrective phase after the completion of the current impulsive wave.
According to the analysis, gray wave 4 of orange wave 3 appears to be completed, marking the transition to gray wave 5 of orange wave 3, which is currently unfolding. This transition suggests that the NZDUSD pair is in the final stages of its impulsive wave sequence within orange wave 3. The analysis includes a critical invalidation level set at 0.60865. If the market price reaches or falls below this level, it would invalidate the current wave count and necessitate a reassessment of the wave structure.
The Elliott Wave Principle, which underpins this analysis, is a technical analysis tool used to predict future market movements by identifying patterns in market cycles. For the NZDUSD 4-hour chart, the primary focus is on the completion of gray wave 5 within orange wave 3. The end of gray wave 4 signals the start of the final impulsive wave before a corrective phase, identified as orange wave 4, is expected to begin.
This analysis provides traders and investors with a structured framework for anticipating future movements in the NZDUSD pair. By identifying the key waves and their positions, the analysis aids in understanding the market's direction and making informed trading decisions.
The invalidation level of 0.60865 acts as a crucial point of reference, ensuring that if the market behaves contrary to the expected wave pattern, traders can adjust their strategies accordingly.
In summary, the NZDUSD Elliott Wave Analysis on the 4-hour chart offers a detailed insight into the market’s current trend. With gray wave 4 of orange wave 3 appearing complete, and gray wave 5 now in play, traders should be prepared for the subsequent corrective phase of orange wave 4. Monitoring the invalidation level is essential to maintaining the accuracy of the wave analysis and adjusting trading strategies as needed.
Technical Analyst: Malik Awais
Source: visit Tradinglounge.com and learn From the Experts Join TradingLounge Here
Previous: U.S.Dollar/Japanese Yen(USDJPY)Elliott Wave Technical Analysis
Special Trial Offer - 0.76 Cents a Day for 3 Months! Click here
Access 7 Analysts Over 170 Markets Covered. Chat Room With Support
