02Jun

VeChain (VETUSD) Elliott Wave Analysis: Identifying Key Fibonacci Support Levels and Forecasting Potential Bullish Reversal Patterns

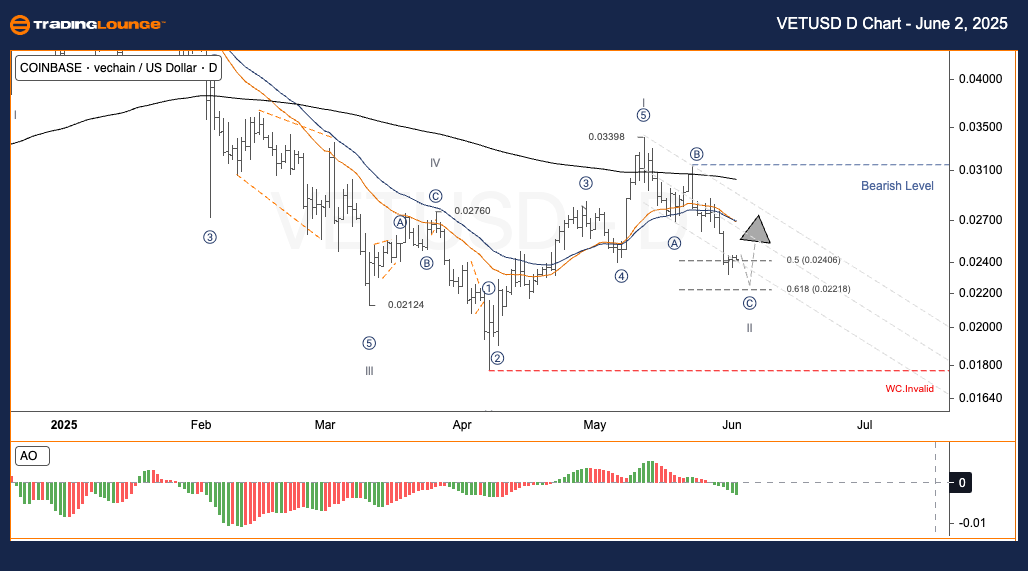
VETUSD Elliott Wave Analysis – TradingLounge Daily Chart

Asset: VeChain / U.S. Dollar (VETUSD) Daily Chart Analysis

VETUSD Elliott Wave Technical Analysis

Function: Trend Following

Mode: Motive

Structure: Impulse

Position: Wave II

Direction of Higher Degree: Pending

Wave Invalid Level: Not Specified

VETUSD Daily Trading Strategy Overview

After completing the primary Wave V near $0.0212, VETUSD surged to $0.0315, finalizing sub-wave ⑤. This move initiated a classic Elliott Wave A-B-C corrective structure, suggesting a temporary pause in the broader uptrend.

At present, VeChain is likely in the final leg of Wave C. The asset is trading within a crucial Fibonacci retracement zone (0.5–0.618), which historically serves as a strong support area in bullish market corrections.

Trading Strategy for Swing Traders

✅ Buy Opportunity: Monitor price action for bullish reversal signals between $0.022 and $0.024.

Risk Management

🟥 Stop-Loss: Recommended under $0.018 to mitigate downside risk.

VETUSD-day-Crypto-Ch...


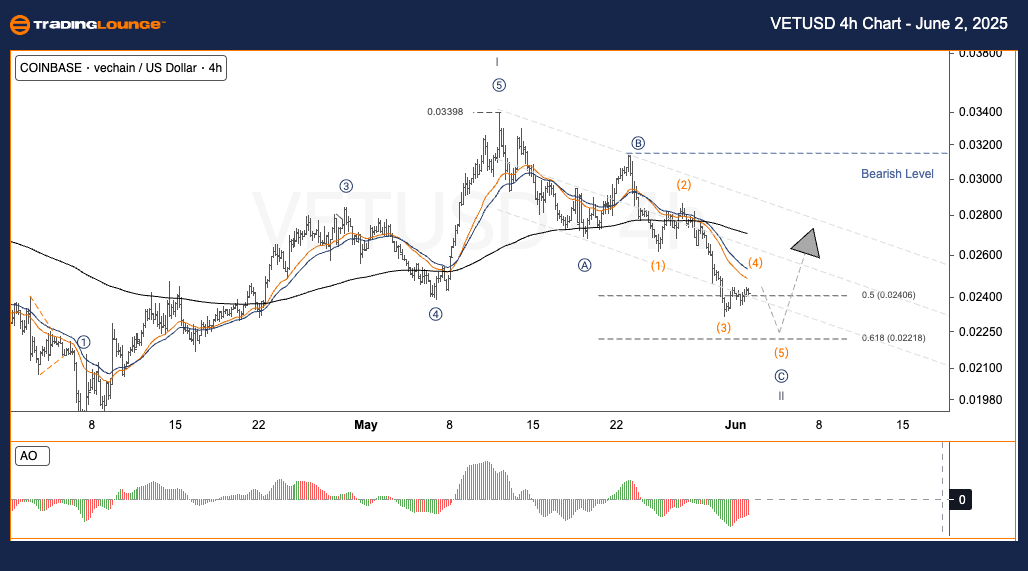
VETUSD Elliott Wave Analysis – TradingLounge H4 Chart

Asset: VeChain / U.S. Dollar (VETUSD) 4-Hour Chart Analysis

VETUSD Elliott Wave Technical Analysis

Function: Trend Following

Mode: Motive

Structure: Impulse

Position: Wave II

Direction of Higher Degree: Pending

Wave Invalid Level: Not Specified

VETUSD H4 Trading Strategy Breakdown

VETUSD rallied from $0.0212 to $0.0315, marking the end of sub-wave ⑤. The pair has since entered an Elliott Wave A-B-C corrective formation, in alignment with the larger bullish momentum.

Wave C appears to be nearing completion, with price consolidating near the 0.5–0.618 Fibonacci support zone. This range frequently acts as a pivot point for bullish reversals post-correction.

Trading Strategy for Swing Traders

✅ Entry Alert: Watch for reversal setups in the $0.022–$0.024 support range.

Risk Management

🟥 Suggested Stop-Loss: Below $0.018 for controlled exposure.

Technical Analyst: Malik Awais

Source: Visit Tradinglounge.com and learn from the Experts. Join TradingLounge Here

Previous: VETUSD Elliott Wave Technical Analysis

VALUE Offer - Buy 1 Month & Get 3 Months!Click here

Access 7 Analysts Over 200 Markets Covered. Chat Room With Support

VETUSD-4h-Crypto-Cha...

Related

State Bank of India stock analysis using Elliott Wave forecast reveals bullish trend, share price movement, and market outlook.

State Bank of India stock analysis using Elliott Wave forecast reveals bullish trend, share price movement, and market outlook.

State Bank of India (SBI) through the lens of Elliott Wave Theory. It highlights the current bullish...

Read More >
Highlights Significant Price Targets In the Upcoming Waves: Silver (XAGUSD) Commodity Elliott Wave Technical Analysis

Highlights Significant Price Targets In the Upcoming Waves: Silver (XAGUSD) Commodity Elliott Wave Technical Analysis

Our detailed silver market analysis utilizes Elliott Wave theory to forecast potential price movemen...

Read More >
New Zealand Dollar/ U.S. Dollar (NZDUSD) Elliott Wave Analysis: Bullish Trend Insights, Wave Structure, and Forex Trading Strategies

New Zealand Dollar/ U.S. Dollar (NZDUSD) Elliott Wave Analysis: Bullish Trend Insights, Wave Structure, and Forex Trading Strategies

Elliott Wave analysis of the NZDUSD currency pair, highlighting the bullish trend, wave structure, a...

Read More >
S&P/ASX 200 Index Elliott Wave Technical Analysis: XJO Trends, Forecasts, and Investment Strategies

S&P/ASX 200 Index Elliott Wave Technical Analysis: XJO Trends, Forecasts, and Investment Strategies

Discover expert insights on S&P/ASX 200 trading and investing with in-depth Elliott Wave analysis, X...

Read More >
NextEra Energy Inc. (NEE) Stocks Elliott Wave Technical Analysis: Offering Insights from Daily and 4-hour charts

NextEra Energy Inc. (NEE) Stocks Elliott Wave Technical Analysis: Offering Insights from Daily and 4-hour charts

This article provides a comprehensive Elliott Wave analysis of NextEra Energy, Inc. (NEE). It covers...

Read More >
Newmont Corporation Elliott Wave Forecast: ASX:NEM Price Target $100 in Bullish Wave 3 With Key Invalidation at $74.25

Newmont Corporation Elliott Wave Forecast: ASX:NEM Price Target $100 in Bullish Wave 3 With Key Invalidation at $74.25

This Elliott Wave analysis of ASX: NEM (Newmont Corporation) outlines bullish wave structure, key le...

Read More >

$1 for 2 Weeks

then $29 a month!

What a Special Offer!

Trade Recommendations

Unleash the power of deversified trading with our comprehensive portfolio, covering 250+ markets:

  • Stock Trades
  • Crypto Trades
  • Forex Trades
  • Commodity Trades
Elliott Wave Analysis

Gain a competitive edge with expert insights and AI-powered Elliott Wave charting into:

  • Global Indices
  • US Stocks & ASX Stocks
  • Forex & Crypto
  • Commodities
Top-Notch Trading Tools

Equip yourself with the tools of success:

  • Real-time Chat rooms
  • Elliott Wave Algorithm
  • Portfolio tools
  • TradingLevels
  • Screener
  • Trading Game
7 Elliott Wave Analysts

Stay ahead of the market with daily charts and insightful videos
Your secret to strategic trading!

JOIN HERE


Welcome to TradingLounge (ASIC A.R.No. 321187), specialists in trades, trading education and technical analysis, covering stocks, indices, commodities, forex and cryptocurrencies.

When you join TradingLounge you have access to everything we offer, including trade tools, educational content and a social platform to chat with like-minded investors.

Read more

@Copyright 2024 by tradinglounge.com

Contact Us

Australian no: 02 4787 6020

International no: +61 (2) 47876020

Pay with:

Find us on