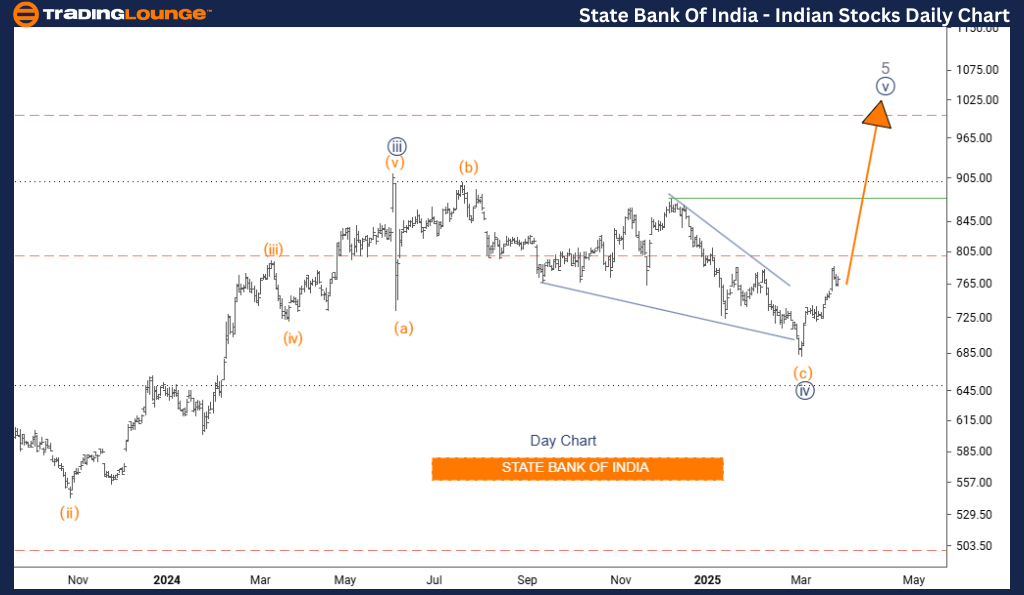
STATE BANK OF INDIA Elliott Wave Analysis – TradingLounge Daily Chart
STATE BANK OF INDIA Elliott Wave Technical Analysis
Function: Bullish Trend
Mode: Impulsive
Structure: Navy Blue Wave 5
Position: Gray Wave 5
Next Higher Degree Direction: Navy Blue Wave 5 (in progress)
The daily chart of State Bank of India (SBI) presents a continuation of a bullish trend, driven by the final impulsive leg of an extended upward structure. The focus now shifts to navy blue wave 5, which completes the broader gray wave 5 formation, signaling a crucial stage in this trend.
Navy blue wave 4 has finalized its corrective movement, and SBI stock is currently progressing within navy blue wave 5—a classic terminal impulse stage that often leads into a significant correction or trend reversal.
Market Context and Strategy
This Elliott Wave phase may indicate the climax of the higher-degree bullish cycle, making it essential for traders to stay vigilant. The daily timeframe offers the most accurate perspective of this impulsive stage within the broader market context.
Investors should closely monitor signs typically associated with fifth waves, including declining momentum, indicator divergence, and lower trading volume, which may suggest that bullish momentum is nearing its end.
Trading Insight
The unfolding of navy blue wave 5 offers short-term trading potential, while also marking the likely conclusion of the gray wave 5 advance. While long positions remain justifiable, tightened risk management is recommended as this wave matures.
This wave setup delivers strategic insights for traders aiming to capitalize on the final bullish leg in State Bank of India stock before a potential reversal.
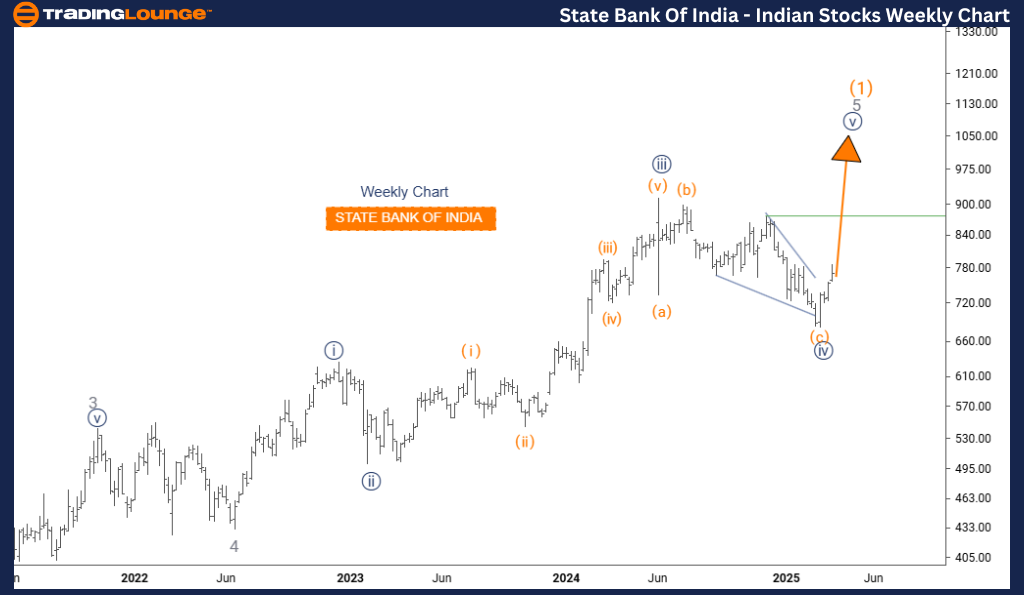
STATE BANK OF INDIA Elliott Wave Analysis – TradingLounge Weekly Chart
STATE BANK OF INDIA Elliott Wave Technical Analysis
Function: Bullish Trend
Mode: Impulsive
Structure: Navy Blue Wave 5
Position: Gray Wave 5 of Orange Wave 1
Next Lower Degree Direction: Orange Wave
Wave Cancel Invalid Level: (Not specified)
The weekly chart of State Bank of India (SBI) supports a long-term bullish forecast, showcasing the last impulsive wave in a larger uptrend. The key wave under observation is navy blue wave 5, which completes gray wave 5, part of a broader orange wave 1 structure.
The completion of navy blue wave 4 sets the stage for the current rally in navy blue wave 5, often representing the final upward surge in the sequence. This development may suggest that SBI stock is approaching a major inflection point.
Market Structure and Outlook
The weekly chart provides a broader technical landscape of SBI's Elliott Wave progression. With navy blue wave 5 now active, it could mark the last substantial move within gray wave 5, wrapping up the bullish journey initiated by orange wave 1.
Investors should pay attention to signs of wave termination, including momentum divergence and volume decline, often seen at the end of extended bullish phases.
Trading Insight
Although the prevailing structure supports holding long positions, increased caution is advised. As the gray wave 5 peaks, implementing stricter risk controls becomes crucial. The weekly view equips position traders with essential insights into the potential end phase of SBI's long-term uptrend.
Technical Analyst: Malik Awais
Source: visit Tradinglounge.com and learn From the Experts Join TradingLounge Here
Previous: COAL INDIA Elliott Wave Technical Analysis
VALUE Offer - Buy 1 Month & Get 3 Months!Click here
Access 7 Analysts Over 200 Markets Covered. Chat Room With Support