ASX: REA GROUP LTD – REA Elliott Elliott Wave Technical Analysis TradingLounge (1D Chart)

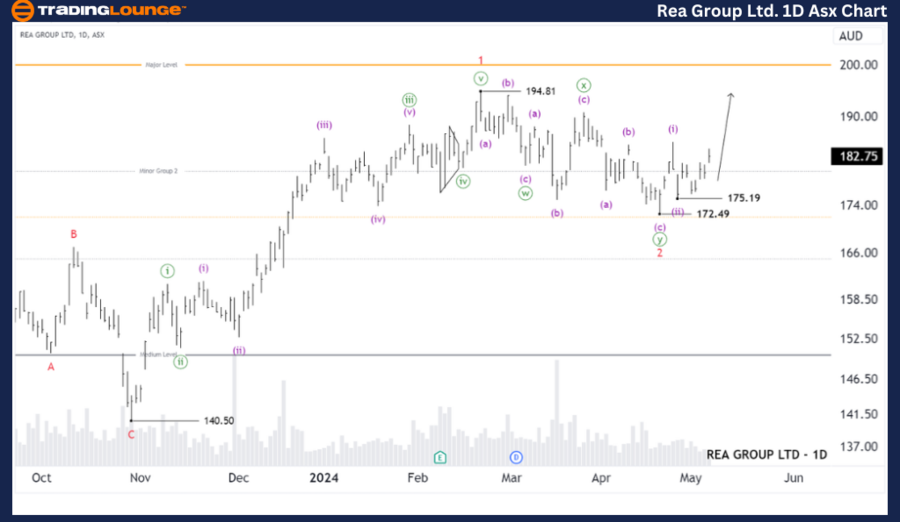
Elliott Wave Analysis on the Daily Chart REA Group Ltd, a major player on the Australian Stock Exchange, is currently exhibiting interesting patterns in its stock movement, according to Elliott Wave principles. Our analysis indicates that the stock may have completed its second wave (red) and is now entering a bullish third wave (red). This phase could significantly propel the stock higher, providing a promising outlook for investors..

ASX: REA GROUP LTD – REA Elliott Wave Technical Analysis

ASX: REA GROUP LTD – REA 1D Chart (Semilog Scale) Analysis

Function: Major trend (Minor degree, red)

Mode: Motive

Structure: Impulse

Position: Wave (iii)-purple of Wave 3-red

Details: The outlook suggests that wave 2-red has recently concluded, and wave 3-red is now unfolding to push higher. It is subdividing into waves (i) and (ii)-purple, which have ended, and wave (iii)-purple is opening up to push higher. Maintaining a price above 172.49 would be a significant advantage for this outlook.

Invalidation point: 140.50

Rea-Group-Ltd-1D-asx...


ASX: REA GROUP LTD – REA Elliott Wave Technical Analysis TradingLounge (4-Hour Chart)

ASX: REA GROUP LTD – REA Elliott Wave Technical Analysis

ASX: REA GROUP LTD – REA 4-Hour Chart Analysis

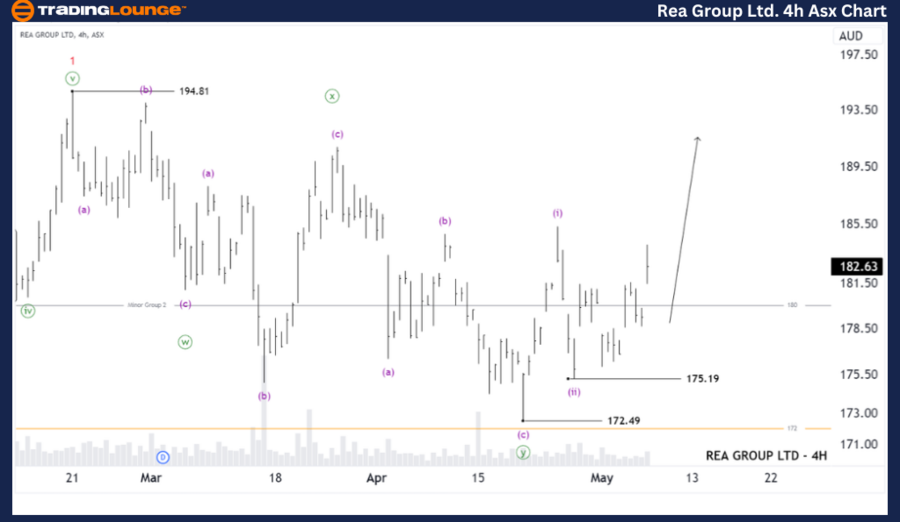
Function: Major trend (Minuette degree, purple)

Mode: Motive

Structure: Impulse

Position: Wave (iii)-purple

Details: The shorter-term outlook suggests that wave (ii)-purple has just ended, and wave (iii)-purple may be unfolding to push higher. However, there's some uncertainty regarding whether wave (ii) has truly concluded. Therefore, it would be preferable to see the price continue to push slightly higher to clarify this perspective. Following that, I would need to observe an ABC correction to prepare for finding a trade setup with better entry and stop levels than the current ones.

Invalidation point: 172.49

Technical Analyst: Hua (Shane) Cuong, CEWA-M (Master’s Designation).

Source: visit Tradinglounge.com and learn From the Experts Join TradingLounge Here 

Previous: Elliott Wave Technical Analysis for WTC on the ASX

Special Trial Offer - 0.76 Cents a Day for 3 Months! Click here

Access 6 Analysts covering over 150 Markets. Chat Room With Support

Rea-Group-Ltd-4hr-as...

Conclusion:  

Our analysis, forecast of contextual trends, and short-term outlook for ASX: REA GROUP LTD – REA aim to provide readers with insights into the current market trends and how to capitalize on them effectively. We offer specific price points that act as validation or invalidation signals for our wave count, enhancing the confidence in our perspective. By combining these factors, we strive to offer readers the most objective and professional perspective on market trends.

Related

XRP/ U.S. dollar(XRPUSD) Elliott Wave Technical Analysis 29 November 23

XRP/ U.S. dollar(XRPUSD) Elliott Wave Technical Analysis 29 November 23

XRP/ U.S. dollar(XRPUSD) Elliott Wave Technical Analysis dated 29 November 23

Read More >
Kotak Mahindra Bank - KOTAKBANK Elliott Wave Technical Chart Shows Bullish Trend With Strong Price Momentum Above 1681

Kotak Mahindra Bank - KOTAKBANK Elliott Wave Technical Chart Shows Bullish Trend With Strong Price Momentum Above 1681

The latest Elliott Wave analysis on Kotak Bank highlights a strong bullish trend with wave 3 unfoldi...

Read More >
Our Gold XAUUSD Commodity Elliott Wave Technical Analysis and Price Forecast for traders and investors Looking Movement

Our Gold XAUUSD Commodity Elliott Wave Technical Analysis and Price Forecast for traders and investors Looking Movement

Unlock expert insights with our Gold Elliott Wave analysis and price forecast. Understand the curren...

Read More >
VETUSD Crypto Pair Analysis Today: VeChain Crypto Price News Elliott Wave Technical Analysis

VETUSD Crypto Pair Analysis Today: VeChain Crypto Price News Elliott Wave Technical Analysis

This article provides a detailed Elliott Wave Analysis of VeChain (VETUSD), including price predicti...

Read More >
GBPAUD Elliott Wave Analysis: Daily Wave 2 Correction & 4‑Hour Wave B Retracement Ahead of Potential Forecasted Breakouts

GBPAUD Elliott Wave Analysis: Daily Wave 2 Correction & 4‑Hour Wave B Retracement Ahead of Potential Forecasted Breakouts

GBPAUD Elliott Wave analysis reveals ongoing corrective waves on both daily (navy blue wave 2 withi...

Read More >
Elliott Wave Analysis: Positive Trends in NDX Tech Stocks and Broader Markets

Elliott Wave Analysis: Positive Trends in NDX Tech Stocks and Broader Markets

Elliott Wave Analysis indicates a strong upward trend in NDX tech stocks, suggesting that the Wave (...

Read More >

$1 for 2 Weeks

then $29 a month!

What a Special Offer!

Trade Recommendations

Unleash the power of deversified trading with our comprehensive portfolio, covering 250+ markets:

  • Stock Trades
  • Crypto Trades
  • Forex Trades
  • Commodity Trades
Elliott Wave Analysis

Gain a competitive edge with expert insights and AI-powered Elliott Wave charting into:

  • Global Indices
  • US Stocks & ASX Stocks
  • Forex & Crypto
  • Commodities
Top-Notch Trading Tools

Equip yourself with the tools of success:

  • Real-time Chat rooms
  • Elliott Wave Algorithm
  • Portfolio tools
  • TradingLevels
  • Screener
  • Trading Game
7 Elliott Wave Analysts

Stay ahead of the market with daily charts and insightful videos
Your secret to strategic trading!

JOIN HERE


Welcome to TradingLounge (ASIC A.R.No. 321187), specialists in trades, trading education and technical analysis, covering stocks, indices, commodities, forex and cryptocurrencies.

When you join TradingLounge you have access to everything we offer, including trade tools, educational content and a social platform to chat with like-minded investors.

Read more

@Copyright 2024 by tradinglounge.com

Contact Us

Australian no: 02 4787 6020

International no: +61 (2) 47876020

Pay with:

Find us on