Walmart Inc. (WMT) Stocks Elliott Wave Technical Insight
Exploring the dynamic world of Walmart Inc. (WMT) through the lens of Elliott Wave analysis offers a comprehensive view of potential market movements. By dissecting the daily and 4-hour charts, we unlock a nuanced understanding of WMT's trend directions and forecast possibilities. This analysis aims to equip traders with critical insights into WMT's future trajectory.
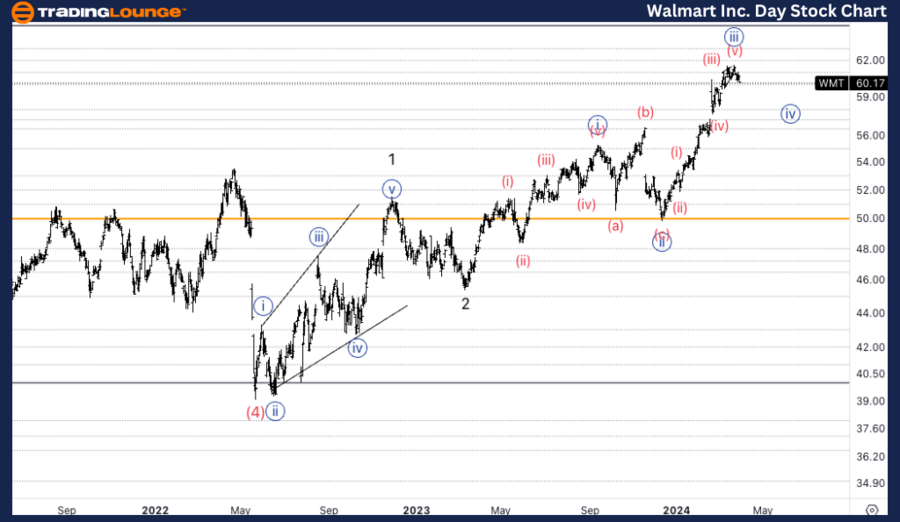
Walmart Inc., (WMT) Daily Chart Analysis
WMT Elliott Wave Technical Analysis
Daily Chart Analysis: Unveiling the Impulse Wave's Power
- Trend Identification: The overarching trend in focus.
- Wave Mode: Impulse, showcasing momentum.
- Wave Structure: Classified as Motive, indicating directional movement.
- Current Position: Minor wave 3 within the larger framework of Intermediate (3).
- Directional Insight: Anticipating an upward journey in wave 3.
As we meticulously analyze Walmart's daily chart, our attention is drawn to the unfolding of Minor Wave 3. This phase signifies a period of pronounced movement, hinting at the emergence of a potential peak in wave {iii}. Given our current stance in a high-degree wave (5), the formation of an ending diagonal is a possibility we are closely monitoring.
Understanding WMT Elliott Wave Analysis Trading Lounge
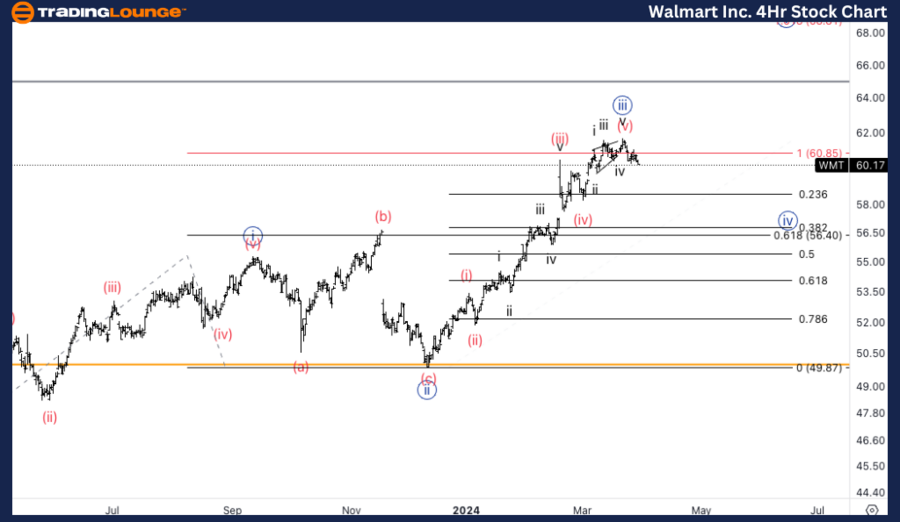
Walmart Inc., (WMT) 4Hr Chart Analysis
WMT Elliott Wave Technical Analysis
4-Hour Chart Analysis: Understanding the Corrective Zigzag Pattern
- Functionality: Emphasizes a Counter Trend perspective.
- Wave Mode: Delving into the Corrective Pattern.
- Structural Composition: Zigzag, revealing a clear directional shift.
- Positional Analysis: Positioned at wave (a) of {iv}.
- Predicted Direction: A downward trajectory towards wave {iv} is anticipated.
In the finer granularity of the 4-hour chart, Walmart's stock behaviour is dissected further to reveal a corrective zigzag pattern, marking a counter-trend move. This phase suggests we might have encountered a peak before reaching the Medium Level of $65, or alternatively, wave {iii} has not yet concluded. Notably, the equality between wave {iii} and {i} was observed at $60.84, marking a significant point in the analysis.
Elliott Wave Analysis: Synthesizing Insights for Traders
The detailed examination of Walmart Inc. (WMT) through Elliott Wave analysis on both daily and 4-hour charts provides traders with a layered understanding of potential market movements. The identification of key trends, wave modes, structures, and directional shifts furnishes investors with the necessary tools to navigate the complexities of the stock market.
As we delve into the specifics of each wave, the analysis highlights critical junctures and possible turning points in WMT's stock trajectory. The anticipation of an upward impulse in the daily chart contrasted with the corrective downward movement in the 4-hour chart encapsulates the multifaceted nature of stock movements, offering a balanced perspective on future developments.
Technical Analyst: Alessio Barretta
Source: visit Tradinglounge.com and learn From the Experts Join TradingLounge Here
See Previous: Apple Inc. (AAPL)
TradingLounge Once Off SPECIAL DEAL: Here > 1 month Get 3 months.
TradingLounge's Free Week Extravaganza!
April 14 – 21: Unlock the Doors to Trading Excellence — Absolutely FREE!
Conclusion: Harnessing Elliott Wave Analysis for Strategic Trading
Elliott Wave Analysis serves as a powerful tool for traders looking to understand and anticipate the intricate movements of Walmart Inc. (WMT). By breaking down the stock's behaviour into impulse and corrective waves, investors are better positioned to make informed decisions. As we continue to monitor the unfolding waves, the insights garnered from this analysis will undoubtedly play a pivotal role in strategic trading decisions.
The dynamic interplay between the daily and 4-hour charts underscores the importance of a detailed and nuanced approach to stock market analysis. With the potential for significant shifts on the horizon, staying attuned to the insights provided by Elliott Wave analysis will be key to navigating the future movements of Walmart Inc. (WMT) with confidence and precision.