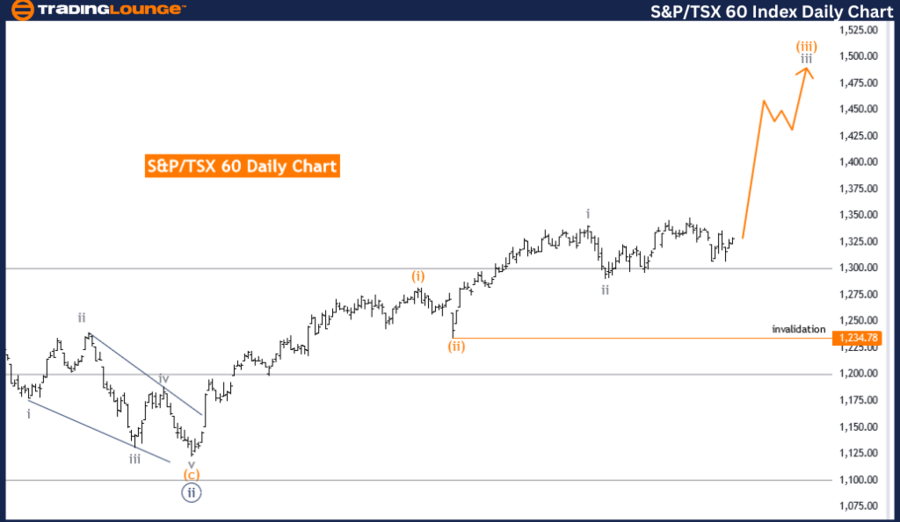
S&P/TSX 60 Elliott Wave Analysis Trading Lounge Day Chart
S&P/TSX 60 Elliott Wave Technical Analysis
FUNCTION: Trend
MODE: Impulsive
STRUCTURE: Gray wave 3
POSITION: Orange wave 3
DIRECTION NEXT LOWER DEGREES: Gray wave 4
DETAILS: After gray wave 2, now gray wave 3 of 3 is in play.
Wave Cancel Invalid Level: 1234.78
The S&P/TSX 60 Elliott Wave analysis on the daily chart shows a trend movement within an impulsive phase identified as gray wave 3. This suggests a strong, directional market movement consistent with the broader trend.
The current structure is gray wave 3, positioned in orange wave 3. This placement implies a significant upward movement within the third wave of the gray degree. The direction for the next lower degrees points to gray wave 4, indicating that after the ongoing impulsive wave completes, the market is expected to enter a corrective phase typical of the fourth wave.
The analysis details that after completing gray wave 2, gray wave 3 of 3 is now in play. This phase represents a robust upward movement within the larger wave structure, signifying a period of strong market activity. The ongoing wave 3 of 3 is typically one of the most powerful segments in the Elliott Wave cycle, often characterized by accelerated price movements and increased market participation.
The wave cancel invalid level is set at 1234.78, serving as a critical threshold for maintaining the current wave structure's validity. If the market price falls below this level, it would invalidate the current wave count, necessitating a reevaluation of the wave structure and possibly altering the analysis.
In summary, the S&P/TSX 60 daily chart analysis reveals a trend movement within an impulsive phase of gray wave 3, currently positioned in orange wave 3. The expected next phase is gray wave 4, which could introduce a corrective movement. Traders should monitor the progress of gray wave 3 of 3 and prepare for the potential transition to gray wave 4, while keeping an eye on the wave cancel invalid level at 1234.78. This analysis provides insight into market dynamics, aiding in making informed trading decisions based on the Elliott Wave theory.

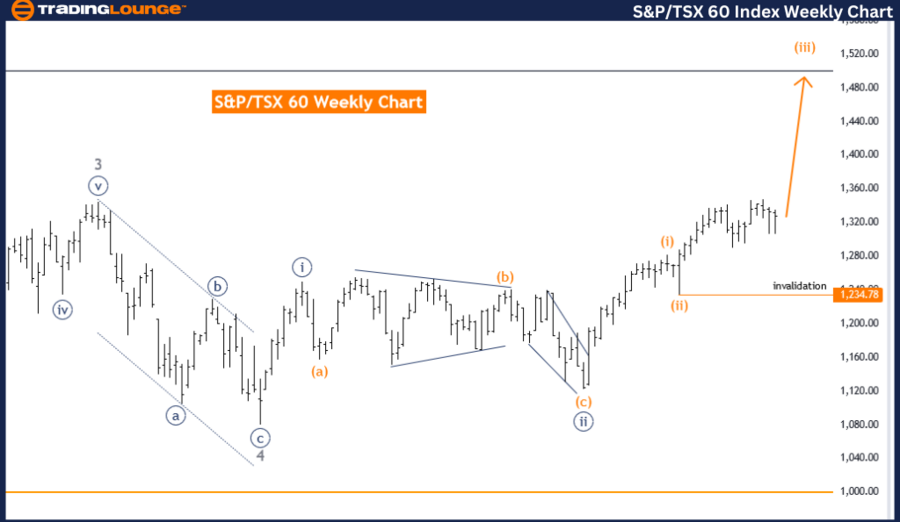
S&P/TSX 60 Elliott Wave Analysis Trading Lounge Weekly Chart
S&P/TSX 60 Elliott Wave Technical Analysis
FUNCTION: Trend
MODE: Impulsive
STRUCTURE: Orange wave 3
POSITION: Navy blue wave 3
DIRECTION NEXT HIGHER DEGREES: Orange wave 3 (continue)
DETAILS: Orange wave 2 looking completed, now orange wave 3 of 3 is in play.
Wave Cancel Invalid Level: 1234.78
The S&P/TSX 60 Elliott Wave analysis on the weekly chart highlights a trend movement characterized by an impulsive mode. This indicates a strong and continuous market direction within the larger trend framework. The current wave structure is identified as orange wave 3, situated within navy blue wave 3, which signifies an ongoing upward momentum in the market.
The analysis reveals that orange wave 2 appears to be completed, setting the stage for orange wave 3 of 3 to come into play. This phase within the Elliott Wave theory typically represents a powerful segment of the overall wave structure, often associated with robust market movements and significant price advancements. The orange wave 3 of 3 is expected to carry on the upward trajectory, aligning with the impulsive nature of the trend.
The direction for the next higher degrees continues to indicate orange wave 3, suggesting that the market will maintain its upward direction within this impulsive wave. This continuity reinforces the expectation of sustained bullish market activity in the coming periods.
The wave cancel invalid level is marked at 1234.78, which serves as a critical point for validating the current wave structure. If the market price were to fall below this level, it would invalidate the ongoing wave count, requiring a reassessment of the wave analysis and possibly altering the current market outlook.
In summary, the S&P/TSX 60 weekly chart analysis points to a strong trend movement within an impulsive wave structure of orange wave 3, positioned in navy blue wave 3. With orange wave 2 considered complete, the market is now experiencing orange wave 3 of 3, indicating a period of intensified upward momentum. The wave cancel invalid level at 1234.78 is crucial for maintaining the integrity of the current wave analysis. This Elliott Wave analysis provides a comprehensive view of market dynamics, assisting traders in making informed decisions based on the anticipated continuation of the trend.
Technical Analyst: Malik Awais
Source: visit Tradinglounge.com and learn From the Experts Join TradingLounge Here
See previous: CAC 40 (France) Elliott Wave Technical Analysis
Special Trial Offer - 0.76 Cents a Day for 3 Months! Click here
Access 7 Analysts Over 170 Markets Covered. Chat Room With Support
