Gold Elliott Wave Analysis – TradingLounge
Long-Term Outlook:
Gold continues to show strong bullish momentum over the long term. After recovering from the April 22 correction, price action is now targeting a breakout above its previous peak, with the potential to establish a new all-time high. The recent retracement that began on June 5 appears to have bottomed, with signs of a near-term rebound developing.
Gold Daily Chart Analysis:
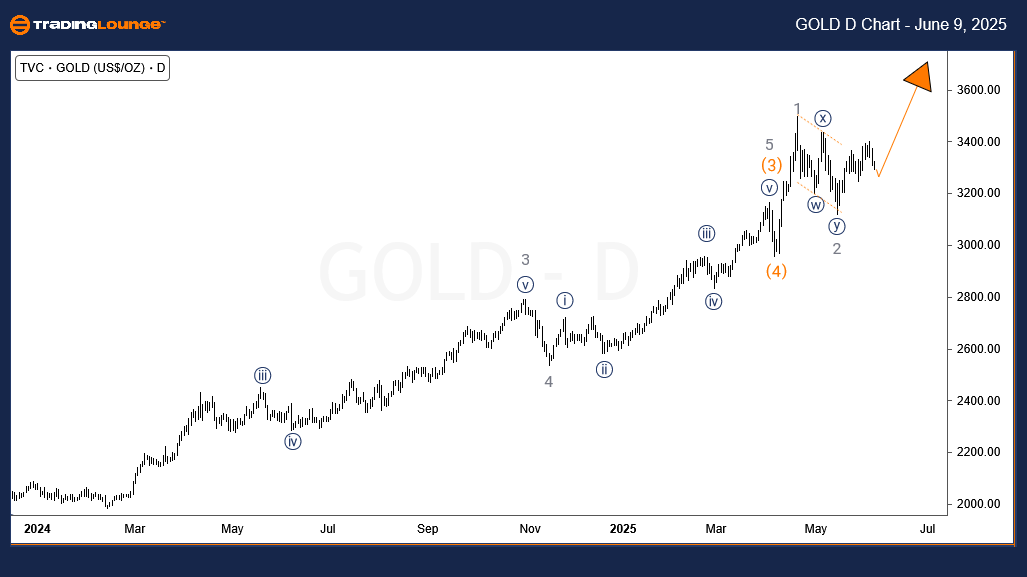
Technically, Gold completed the primary wave ((4)) of I of (III) in November 2022. Since then, the trend structure has held a bullish form, with minor corrective moves supporting the broader rally. Currently, wave ((5)) from the November 2022 low is still progressing.
Our wave count suggests Gold is advancing within wave (5) of ((5)) of I. Wave 1 of (5) wrapped up on April 21, 2025, followed by a corrective phase—wave 2 of (5)—which ended on May 14, 2025. From that low, wave 3 of (5) initiated, aiming for the 3878–4008 price range. This zone represents a key medium-term target for traders positioning during pullbacks.
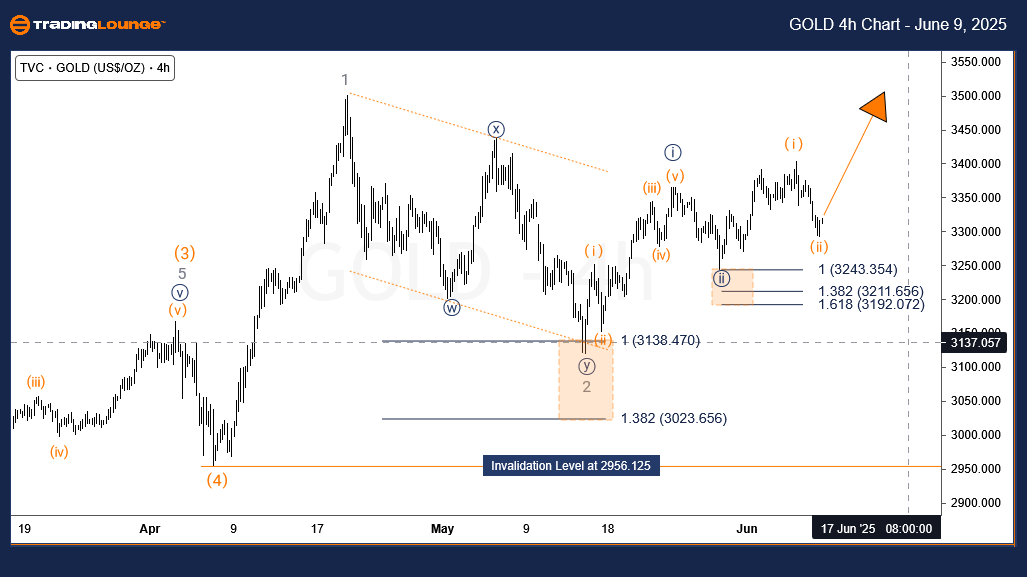
Gold H4 Chart Analysis:
On the H4 chart, wave ((i)) and ((ii)) of 3 finalized on May 23 and May 28, respectively. A subsequent 5-wave rally indicates completion of wave (i) of ((iii)). The latest decline is labeled as wave (ii) of ((iii)) and may extend into the 3510–3547 support zone.
Alternatively, if the June 5 drop evolves into a continued downward leg on lower timeframes, a full 5-wave decline may unfold. In that case, wave ((i)) concluded on May 23, and the current pattern could be forming an irregular flat for wave ((ii)). Despite these short-term variations, the broader trend remains bullish.
Technical Analyst: Sanmi Adeagbo
Source: Visit Tradinglounge.com and learn from the Experts. Join TradingLounge Here
See Previous: SGX TSI Elliott Wave Technical Analysis
VALUE Offer - Buy 1 Month & Get 3 Months!Click here
Access 7 Analysts Over 200 Markets Covered. Chat Room With Support